ZYRA vs SNX: Battling for Dominance in the Decentralized Finance Arena
Introduction: ZYRA vs SNX Investment Comparison
In the cryptocurrency market, the comparison between ZYRA and SNX has been an unavoidable topic for investors. The two not only show significant differences in market cap ranking, application scenarios, and price performance but also represent different positioning in the crypto asset space.
ZYRA (ZYRA): Launched in 2025, it has gained market recognition for its role in Bitcoin Layer 2 scaling and governance.
SNX (SNX): Since its introduction in 2018, it has been hailed as a decentralized finance (DeFi) platform for synthetic assets, becoming one of the most traded and valued cryptocurrencies in the DeFi space.
This article will comprehensively analyze the investment value comparison between ZYRA and SNX, focusing on historical price trends, supply mechanisms, institutional adoption, technological ecosystems, and future predictions, attempting to answer the question investors care about most:
"Which is the better buy right now?"
I. Price History Comparison and Current Market Status
ZYRA (Coin A) and SNX (Coin B) Historical Price Trends
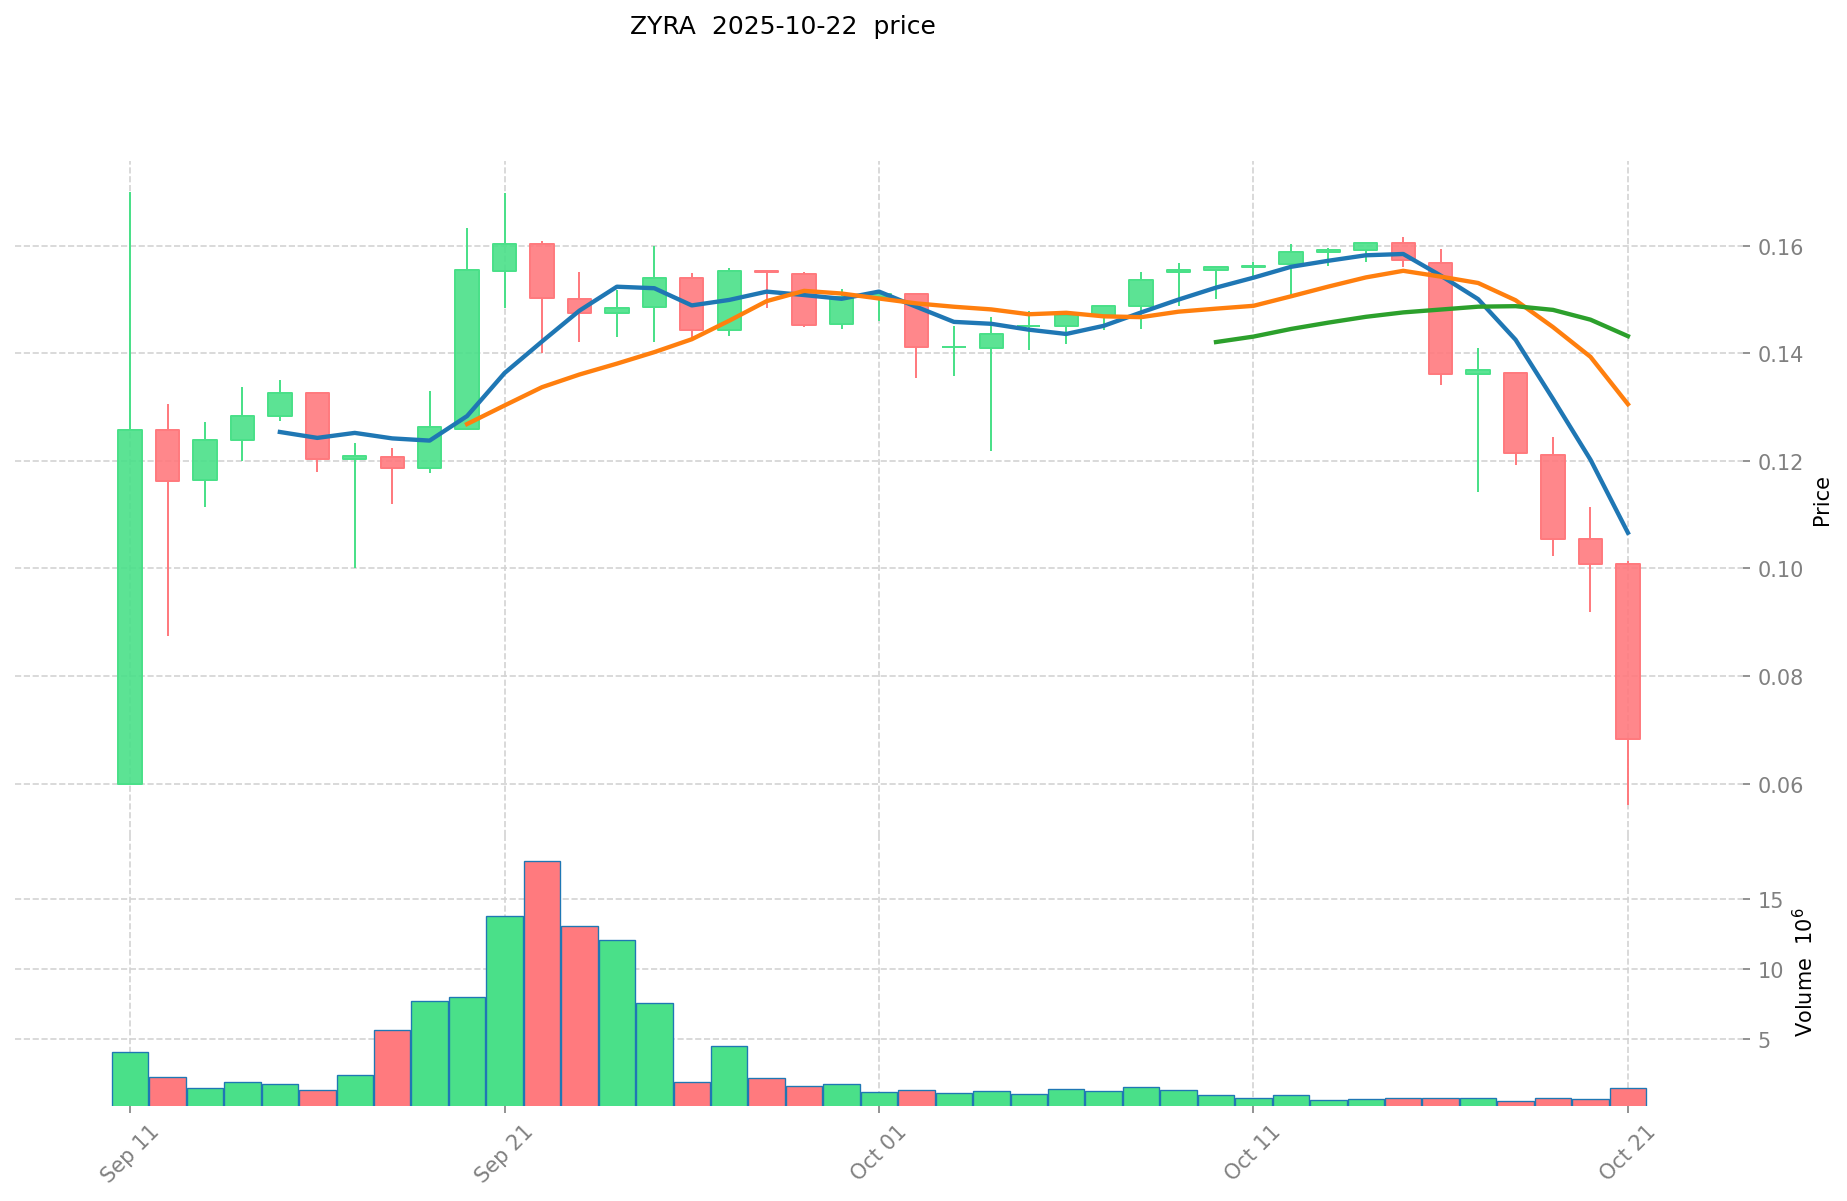
- 2025: ZYRA reached an all-time high of $0.17 on September 11, 2025.
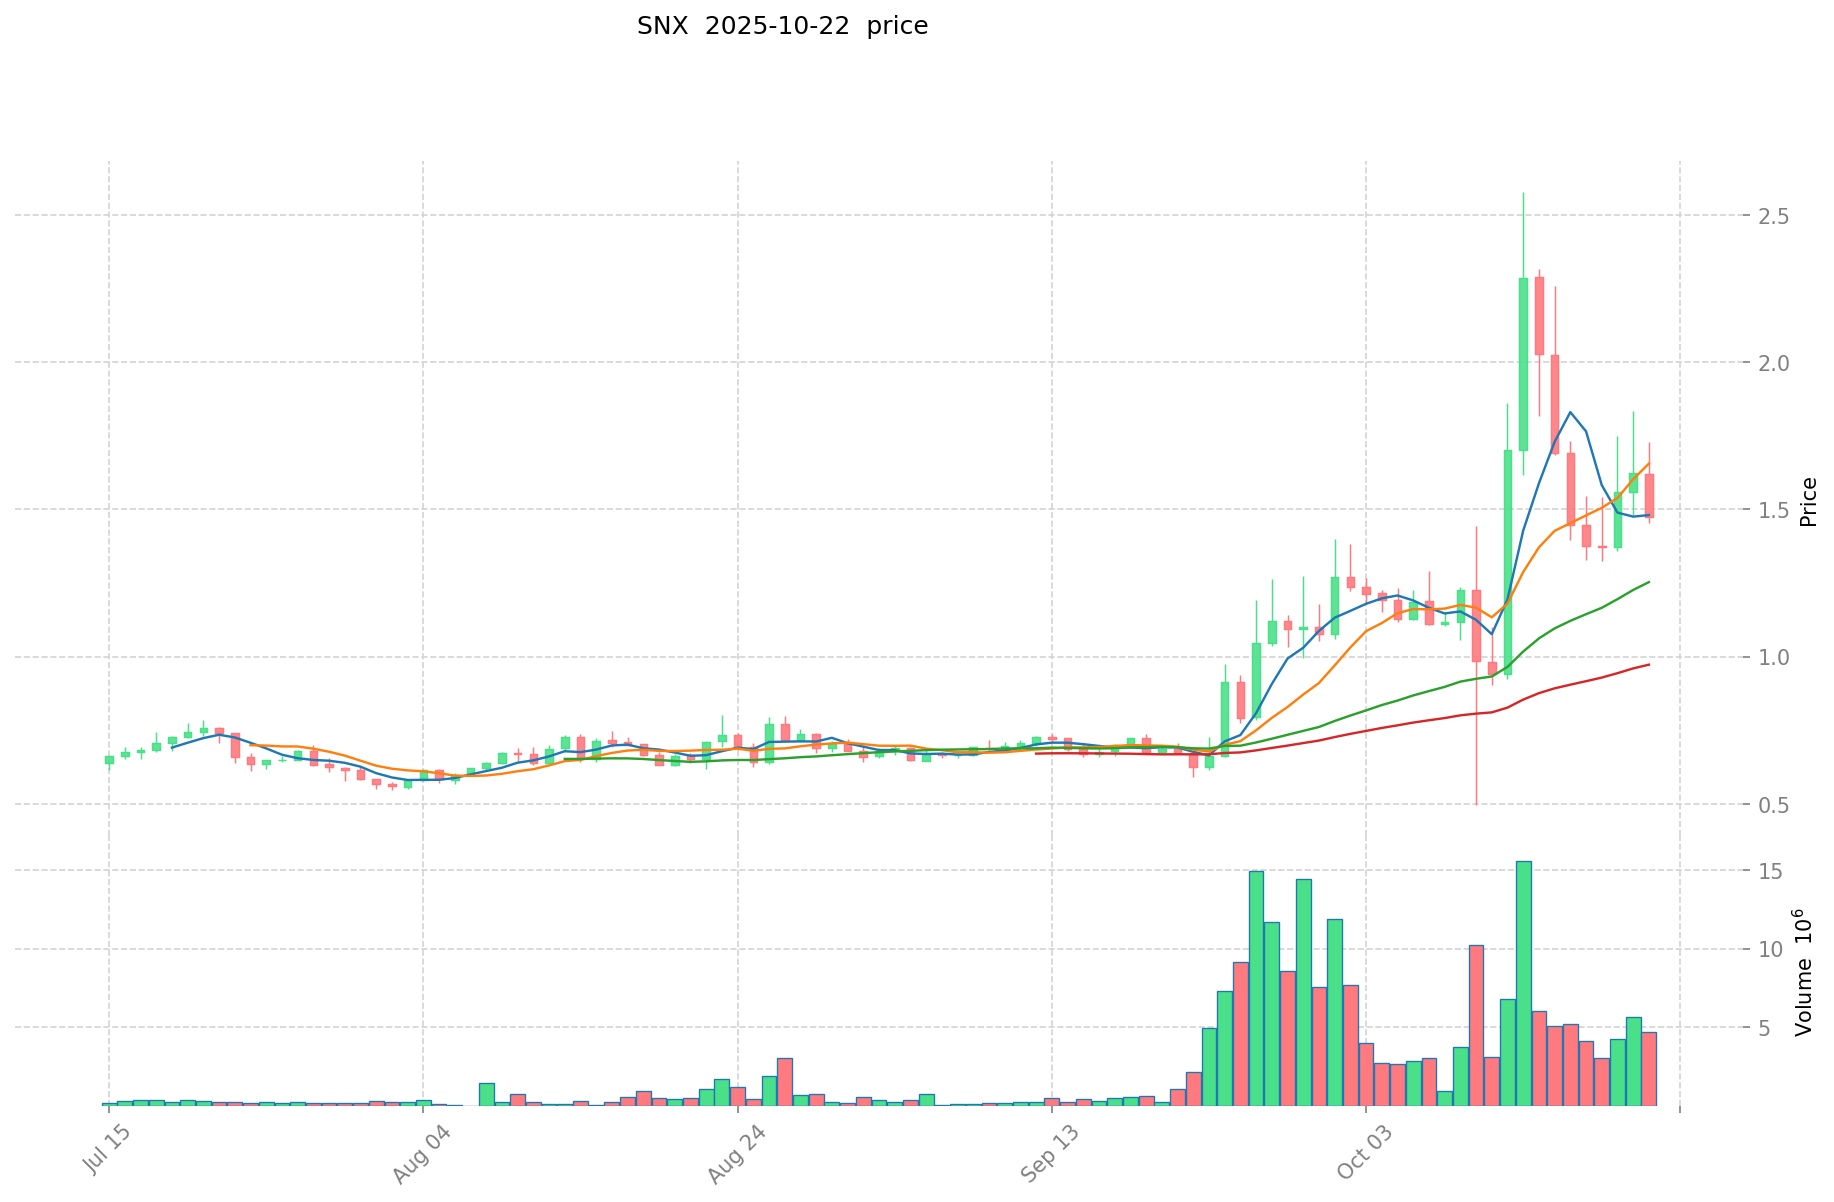
- 2025: SNX experienced significant volatility, dropping from its all-time high of $28.53 to current levels.
- Comparative analysis: In the recent market cycle, ZYRA dropped from its high of $0.17 to a low of $0.056, while SNX has shown more resilience, maintaining a higher price point despite market fluctuations.
Current Market Situation (2025-10-22)
- ZYRA current price: $0.0665
- SNX current price: $1.4709
- 24-hour trading volume: ZYRA $112,515.98 vs SNX $7,373,271.41
- Market Sentiment Index (Fear & Greed Index): 34 (Fear)
Click to view real-time prices:
- View ZYRA current price Market Price
- View SNX current price Market Price
Investment Value Analysis: ZYRA vs SNX
Core Factors Affecting ZYRA vs SNX Investment Value
Economic Cycle Impact
- Real Interest Rate: The true yield rate after inflation expectations, serving as a core parameter influencing asset valuation
- Fisher Effect: Nominal rate = real rate + inflation expectations, explaining inflation's transmission mechanism to interest rates
- Market Timing: Performance varies significantly across different economic cycle phases (recession, recovery, prosperity, decline)
Inflation-Adjusted Valuation Metrics
- CPI-PE (Inflation-Adjusted P/E Ratio): CPI-PE = Price / CPI-Adjusted EPS
- Real PB (Inflation-Adjusted P/B Ratio): Real PB = Price / PPI-Adjusted Net Asset Value Per Share
- 📌 Historical Pattern: Traditional metrics often fail during high inflation periods, while inflation-adjusted metrics provide clearer valuation insights
Quantitative Value Analysis Framework
- Value Profiles: Building sector-specific value indicators using quantitative models
- Quality/Prospect Profiles: Identifying growth potential beyond traditional metrics
- Industry Rotation Strategy: Positioning assets based on economic cycle phase (recession, recovery, boom, slowdown)
Macro-Economic Considerations
- Price Direction Forecasting: Monetary supply (M2) typically leads price trends by approximately 6 months
- Inflation/Deflation Impact: Financial assets (stocks, bonds) typically outperform during deflation; physical assets outperform during inflation
- Monetary Policy Effects: Increasing money supply can lead to stagflation risk and asset bubbles; decreasing supply may cause debt chain breaks but supports financial asset prices
III. 2025-2030 Price Prediction: ZYRA vs SNX
Short-term Prediction (2025)
- ZYRA: Conservative $0.0481 - $0.0625 | Optimistic $0.0625 - $0.0925
- SNX: Conservative $0.9177 - $1.4801 | Optimistic $1.4801 - $2.1165
Mid-term Prediction (2027)
- ZYRA may enter a growth phase, with estimated prices ranging from $0.0740 to $0.1149
- SNX may enter a bullish market, with estimated prices ranging from $1.8257 to $2.2141
- Key drivers: Institutional capital inflow, ETF developments, ecosystem growth
Long-term Prediction (2030)
- ZYRA: Base scenario $0.0764 - $0.1233 | Optimistic scenario $0.1233 - $0.1726
- SNX: Base scenario $1.7311 - $2.7921 | Optimistic scenario $2.7921 - $4.1603
Disclaimer: This analysis is based on historical data and market projections. Cryptocurrency markets are highly volatile and unpredictable. This information should not be considered as financial advice. Always conduct your own research before making investment decisions.
ZYRA:
| 年份 | 预测最高价 | 预测平均价格 | 预测最低价 | 涨跌幅 |
|---|---|---|---|---|
| 2025 | 0.0925148 | 0.06251 | 0.0481327 | -6 |
| 2026 | 0.079837772 | 0.0775124 | 0.048057688 | 16 |
| 2027 | 0.11486562556 | 0.078675086 | 0.07395458084 | 18 |
| 2028 | 0.1325753874186 | 0.09677035578 | 0.0716100632772 | 45 |
| 2029 | 0.131873802339195 | 0.1146728715993 | 0.094031754711426 | 72 |
| 2030 | 0.172582671756946 | 0.123273336969247 | 0.076429468920933 | 85 |
SNX:
| 年份 | 预测最高价 | 预测平均价格 | 预测最低价 | 涨跌幅 |
|---|---|---|---|---|
| 2025 | 2.116543 | 1.4801 | 0.917662 | 0 |
| 2026 | 2.08605294 | 1.7983215 | 1.22285862 | 21 |
| 2027 | 2.2140934308 | 1.94218722 | 1.8256559868 | 31 |
| 2028 | 2.930177858814 | 2.0781403254 | 1.517042437542 | 40 |
| 2029 | 3.08011568329161 | 2.504159092107 | 1.42737068250099 | 69 |
| 2030 | 4.160284707671964 | 2.792137387699305 | 1.731125180373569 | 89 |
IV. Investment Strategy Comparison: ZYRA vs SNX
Long-term vs Short-term Investment Strategies
- ZYRA: Suitable for investors focused on Bitcoin Layer 2 scaling and governance potential
- SNX: Suitable for investors interested in DeFi and synthetic assets
Risk Management and Asset Allocation
- Conservative investors: ZYRA: 30% vs SNX: 70%
- Aggressive investors: ZYRA: 60% vs SNX: 40%
- Hedging tools: Stablecoin allocation, options, cross-currency portfolios
V. Potential Risk Comparison
Market Risk
- ZYRA: Relatively new project, potential for high volatility
- SNX: Exposure to DeFi market fluctuations
Technical Risk
- ZYRA: Scalability, network stability
- SNX: Smart contract vulnerabilities, oracle dependence
Regulatory Risk
- Global regulatory policies may have differing impacts on both assets
VI. Conclusion: Which Is the Better Buy?
📌 Investment Value Summary:
- ZYRA advantages: Potential in Bitcoin Layer 2 scaling, newer project with room for growth
- SNX advantages: Established presence in DeFi, synthetic asset platform
✅ Investment Advice:
- Novice investors: Consider a balanced approach with a higher allocation to SNX due to its more established market presence
- Experienced investors: Explore opportunities in both, with a potential higher risk-reward ratio in ZYRA
- Institutional investors: Conduct thorough due diligence on both projects, consider ZYRA for long-term potential and SNX for current DeFi exposure
⚠️ Risk Warning: The cryptocurrency market is highly volatile. This article does not constitute investment advice. None
VII. FAQ
Q1: What are the main differences between ZYRA and SNX? A: ZYRA is focused on Bitcoin Layer 2 scaling and governance, launched in 2025. SNX is a decentralized finance (DeFi) platform for synthetic assets, introduced in 2018.
Q2: Which coin has performed better in terms of price recently? A: SNX has shown more resilience in the recent market cycle, maintaining a higher price point despite market fluctuations. ZYRA, being newer, has experienced significant volatility since its launch.
Q3: What are the current prices of ZYRA and SNX? A: As of 2025-10-22, ZYRA's price is $0.0665, while SNX's price is $1.4709.
Q4: How do the long-term price predictions for ZYRA and SNX compare? A: By 2030, ZYRA is predicted to reach $0.0764 - $0.1726 in various scenarios, while SNX is expected to reach $1.7311 - $4.1603.
Q5: What are the main risks associated with investing in ZYRA and SNX? A: ZYRA faces risks related to its newness and potential volatility. SNX is exposed to DeFi market fluctuations and smart contract vulnerabilities. Both face regulatory risks.
Q6: How should different types of investors approach ZYRA and SNX? A: Novice investors might consider a higher allocation to SNX due to its established presence. Experienced investors could explore both, with potentially higher risk-reward in ZYRA. Institutional investors should conduct thorough due diligence on both projects.
Q7: What factors should be considered when valuing these cryptocurrencies? A: Investors should consider economic cycles, inflation-adjusted valuation metrics, quantitative value analysis, and macro-economic factors such as monetary policy and inflation/deflation impacts.
Share
Content
Introduction: ZYRA vs SNX Investment Comparison
I. Price History Comparison and Current Market Status
Core Factors Affecting ZYRA vs SNX Investment Value
III. 2025-2030 Price Prediction: ZYRA vs SNX
IV. Investment Strategy Comparison: ZYRA vs SNX
V. Potential Risk Comparison
VI. Conclusion: Which Is the Better Buy?
VII. FAQ

