VRA vs QNT: Comparing Two Promising Cryptocurrencies in the Digital Asset Space
Introduction: VRA vs QNT Investment Comparison
In the cryptocurrency market, Verasity vs Quant comparison has always been an unavoidable topic for investors. The two not only have significant differences in market cap ranking, application scenarios, and price performance, but also represent different positioning in crypto assets.
Verasity (VRA): Since its launch in 2019, it has gained market recognition for its next-generation video platform that enables direct transactions between creators and viewers on the blockchain.
Quant (QNT): Since its inception in 2018, it has been hailed as a technology provider enabling trusted digital interactions, leading the way in enterprise innovation and blockchain adoption.
This article will comprehensively analyze the investment value comparison between VRA and QNT, focusing on historical price trends, supply mechanisms, institutional adoption, technological ecosystems, and future predictions, attempting to answer the question investors care most about:
"Which is the better buy right now?"
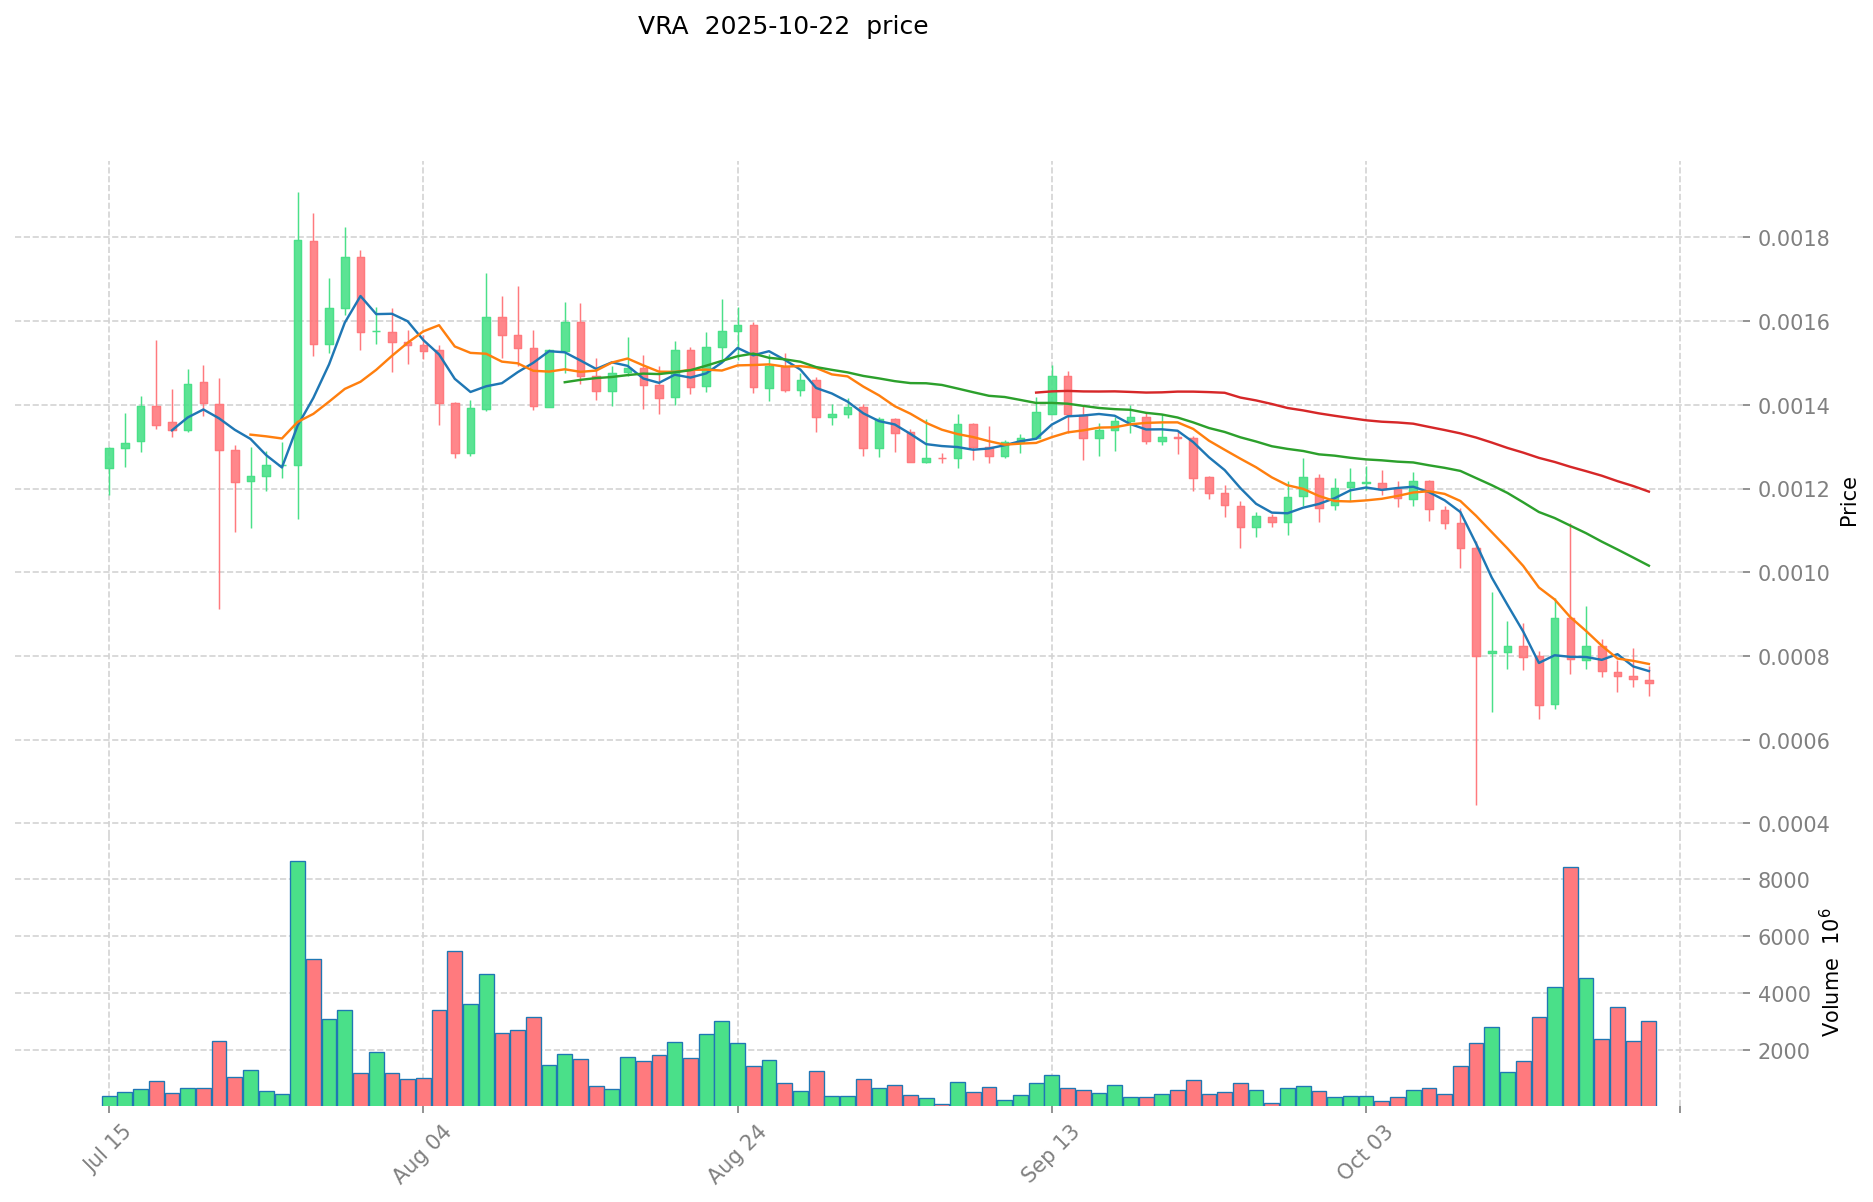
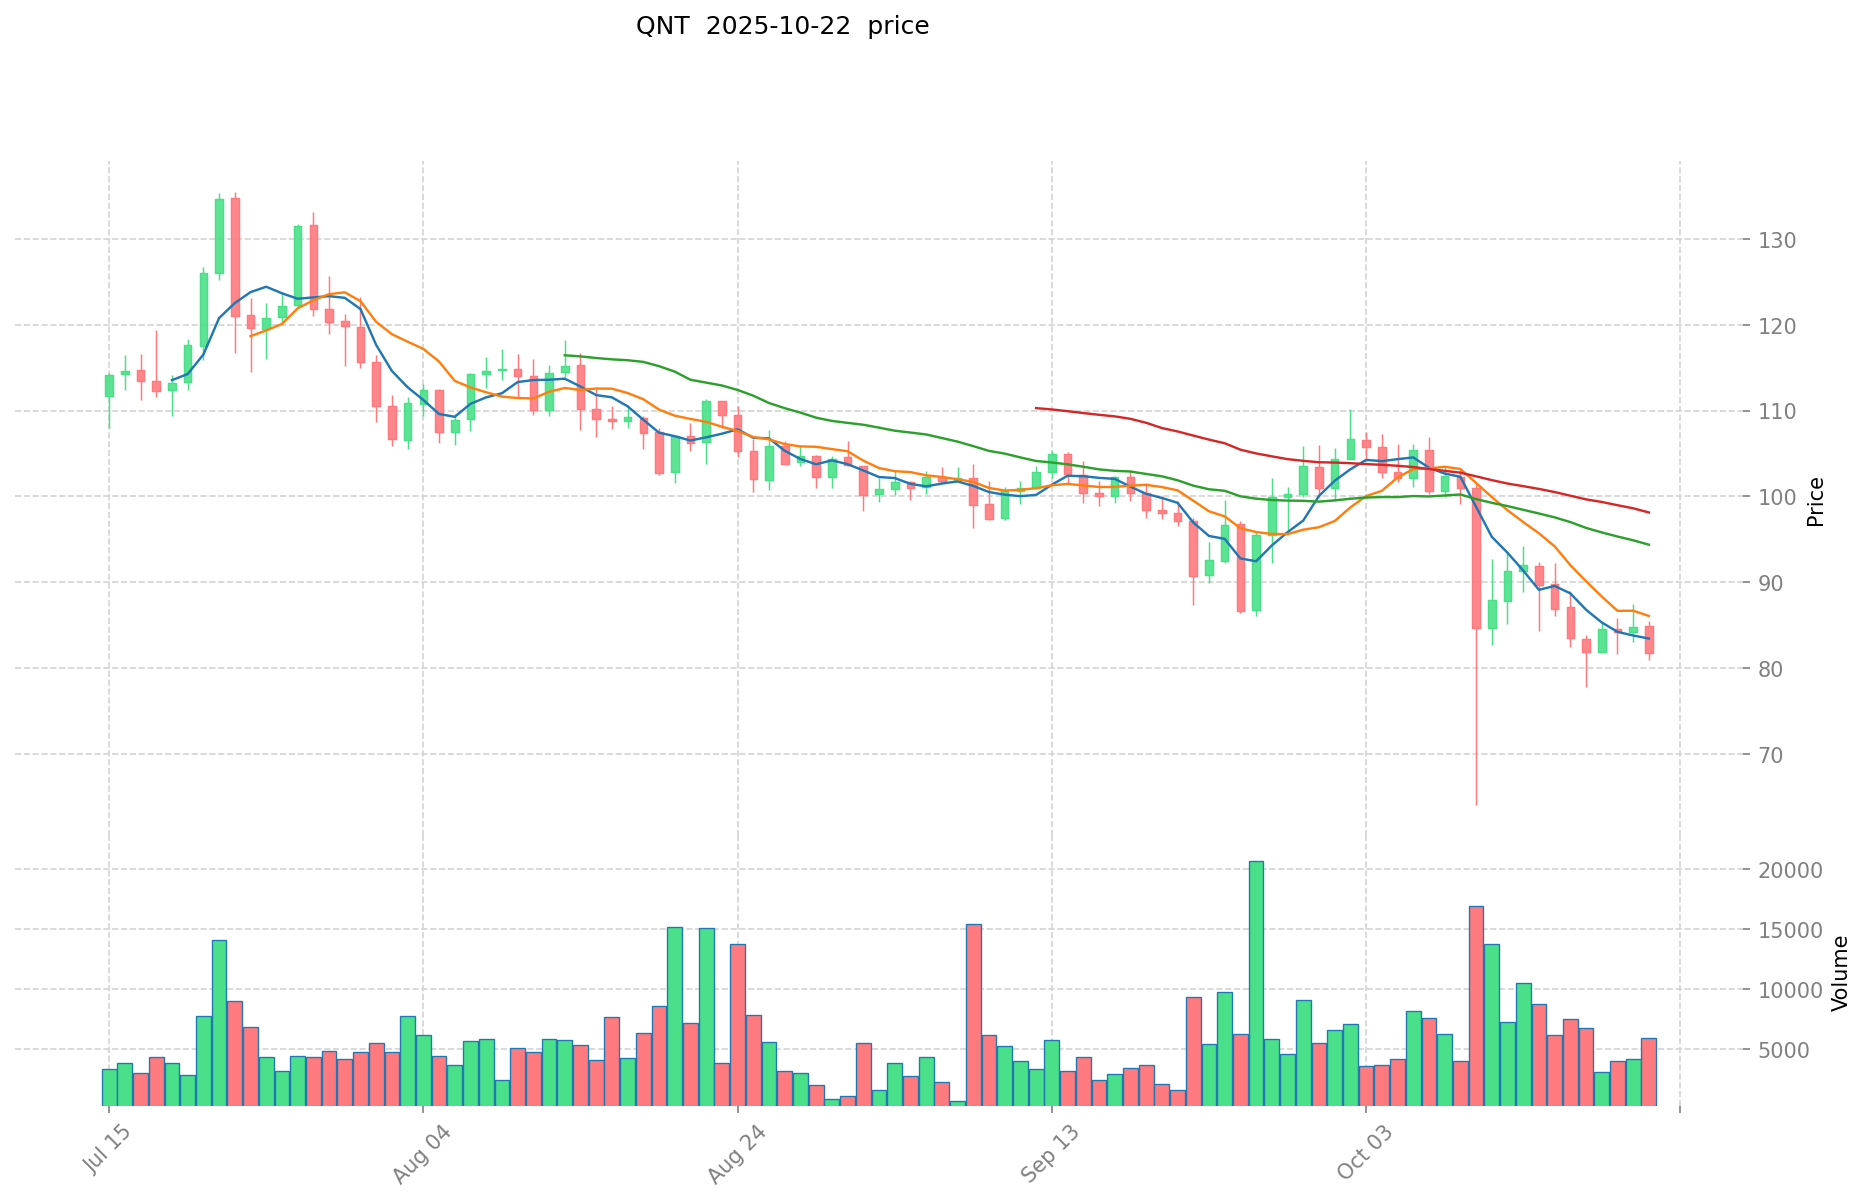
I. Price History Comparison and Current Market Status
VRA and QNT Historical Price Trends
- 2021: VRA reached its all-time high of $0.086208 due to increased interest in video verification technology.
- 2021: QNT hit its record high of $427.42 as blockchain interoperability gained traction.
- Comparative analysis: During the 2022 crypto winter, VRA dropped from its peak to near its all-time low, while QNT showed more resilience, maintaining a higher price level.
Current Market Situation (2025-10-22)
- VRA current price: $0.0007229
- QNT current price: $81.53
- 24-hour trading volume: VRA $2,246,826 vs QNT $496,891
- Market Sentiment Index (Fear & Greed Index): 25 (Extreme Fear)
Click to view real-time prices:
- View VRA current price Market Price
- View QNT current price Market Price
II. Core Factors Affecting VRA vs QNT Investment Value
Supply Mechanism Comparison (Tokenomics)
- VRA: Limited supply mechanism with focus on network utility
- QNT: Fixed supply model creating scarcity by design
- 📌 Historical pattern: Supply mechanisms drive price cycles based on network adoption and utility milestones.
Institutional Adoption and Market Applications
- Institutional holdings: QNT shows stronger institutional interest
- Enterprise adoption: VRA focuses on content verification while QNT targets interoperability in financial networks
- Regulatory stance: Both tokens face varying regulatory approaches across jurisdictions
Technical Development and Ecosystem Building
- VRA technical upgrades: Proof of View protocol advancement
- QNT technical development: Overledger network expansion
- Ecosystem comparison: QNT has stronger enterprise integration while VRA shows promise in content verification space
Macroeconomic Factors and Market Cycles
- Performance during inflation: Both show moderate correlation with broader market trends
- Macroeconomic monetary policy: Interest rates impact overall market liquidity affecting both tokens
- Geopolitical factors: Cross-border transaction demand potentially benefits QNT's interoperability focus
III. 2025-2030 Price Prediction: VRA vs QNT
Short-term Prediction (2025)
- VRA: Conservative $0.000560352 - $0.0007184 | Optimistic $0.0007184 - $0.001070416
- QNT: Conservative $54.6117 - $81.51 | Optimistic $81.51 - $91.2912
Mid-term Prediction (2027)
- VRA may enter a growth phase, with prices expected in the range of $0.0009791084376 - $0.0013531498632
- QNT may enter a bullish market, with prices expected in the range of $73.5269106 - $116.2520073
- Key drivers: Institutional capital inflow, ETF, ecosystem development
Long-term Prediction (2030)
- VRA: Base scenario $0.001176514284067 - $0.001548045110615 | Optimistic scenario $0.001548045110615 - $0.002275626312604
- QNT: Base scenario $127.6375420968648 - $145.04266147371 | Optimistic scenario $145.04266147371 - $172.6007671537149
Disclaimer: This analysis is for informational purposes only and should not be considered as financial advice. Cryptocurrency markets are highly volatile and unpredictable. Always conduct your own research before making investment decisions.
VRA:
| 年份 | 预测最高价 | 预测平均价格 | 预测最低价 | 涨跌幅 |
|---|---|---|---|---|
| 2025 | 0.001070416 | 0.0007184 | 0.000560352 | 0 |
| 2026 | 0.00130583568 | 0.000894408 | 0.0006260856 | 23 |
| 2027 | 0.0013531498632 | 0.00110012184 | 0.0009791084376 | 52 |
| 2028 | 0.001680491116692 | 0.0012266358516 | 0.001079439549408 | 69 |
| 2029 | 0.001642526737084 | 0.001453563484146 | 0.001264600231207 | 101 |
| 2030 | 0.002275626312604 | 0.001548045110615 | 0.001176514284067 | 114 |
QNT:
| 年份 | 预测最高价 | 预测平均价格 | 预测最低价 | 涨跌幅 |
|---|---|---|---|---|
| 2025 | 91.2912 | 81.51 | 54.6117 | 0 |
| 2026 | 112.32078 | 86.4006 | 58.752408 | 5 |
| 2027 | 116.2520073 | 99.36069 | 73.5269106 | 21 |
| 2028 | 159.553396002 | 107.80634865 | 94.869586812 | 32 |
| 2029 | 156.40545062142 | 133.679872326 | 82.88152084212 | 63 |
| 2030 | 172.6007671537149 | 145.04266147371 | 127.6375420968648 | 77 |
IV. Investment Strategy Comparison: VRA vs QNT
Long-term vs Short-term Investment Strategies
- VRA: Suitable for investors focusing on content verification and video platform potential
- QNT: Suitable for investors seeking enterprise blockchain solutions and interoperability
Risk Management and Asset Allocation
- Conservative investors: VRA: 20% vs QNT: 80%
- Aggressive investors: VRA: 40% vs QNT: 60%
- Hedging tools: Stablecoin allocation, options, cross-currency portfolio
V. Potential Risk Comparison
Market Risks
- VRA: Higher volatility due to smaller market cap and niche focus
- QNT: Potential overvaluation in enterprise blockchain sector
Technical Risks
- VRA: Scalability, network stability
- QNT: Centralization concerns, potential security vulnerabilities
Regulatory Risks
- Global regulatory policies may have differing impacts on both tokens
VI. Conclusion: Which Is the Better Buy?
📌 Investment Value Summary:
- VRA advantages: Innovative video verification technology, potential for growth in content creator economy
- QNT advantages: Strong enterprise adoption, interoperability focus, institutional interest
✅ Investment Advice:
- New investors: Consider a balanced approach with a higher allocation to QNT for stability
- Experienced investors: Explore opportunities in both, with a tilt towards VRA for higher potential returns
- Institutional investors: Focus on QNT due to its enterprise-grade solutions and regulatory compliance
⚠️ Risk Warning: Cryptocurrency markets are highly volatile. This article does not constitute investment advice. None
FAQ
Q1: What are the main differences between VRA and QNT? A: VRA focuses on next-generation video platforms and content verification, while QNT specializes in enterprise blockchain solutions and interoperability. VRA has a smaller market cap and higher volatility, whereas QNT shows stronger institutional interest and enterprise adoption.
Q2: Which token has performed better historically? A: QNT has shown more resilience during market downturns. In 2021, VRA reached its all-time high of $0.086208, while QNT hit $427.42. During the 2022 crypto winter, QNT maintained a higher price level compared to VRA.
Q3: How do their supply mechanisms differ? A: VRA has a limited supply mechanism focused on network utility, while QNT has a fixed supply model designed to create scarcity. These mechanisms influence price cycles based on network adoption and utility milestones.
Q4: What are the long-term price predictions for VRA and QNT? A: By 2030, VRA's base scenario predicts a range of $0.001176514284067 - $0.001548045110615, with an optimistic scenario of $0.001548045110615 - $0.002275626312604. For QNT, the base scenario predicts $127.6375420968648 - $145.04266147371, with an optimistic scenario of $145.04266147371 - $172.6007671537149.
Q5: How should investors allocate their assets between VRA and QNT? A: Conservative investors might consider allocating 20% to VRA and 80% to QNT, while aggressive investors could opt for 40% VRA and 60% QNT. The exact allocation should be based on individual risk tolerance and investment goals.
Q6: What are the main risks associated with investing in VRA and QNT? A: VRA faces higher volatility due to its smaller market cap and niche focus, as well as potential scalability and network stability issues. QNT risks include potential overvaluation in the enterprise blockchain sector and centralization concerns. Both tokens are subject to regulatory risks that may vary across jurisdictions.
Q7: Which token is considered a better buy for different types of investors? A: New investors might consider a balanced approach with a higher allocation to QNT for stability. Experienced investors could explore opportunities in both, with a tilt towards VRA for higher potential returns. Institutional investors may focus on QNT due to its enterprise-grade solutions and regulatory compliance.
Share
Content
Introduction: VRA vs QNT Investment Comparison
I. Price History Comparison and Current Market Status
II. Core Factors Affecting VRA vs QNT Investment Value
III. 2025-2030 Price Prediction: VRA vs QNT
IV. Investment Strategy Comparison: VRA vs QNT
V. Potential Risk Comparison
VI. Conclusion: Which Is the Better Buy?
FAQ

