SATS vs BTC: The Battle for Bitcoin's Smallest Unit and Its Impact on Adoption
Introduction: Investment Comparison of SATS vs BTC
In the cryptocurrency market, the comparison between SATS vs BTC has always been a topic that investors can't ignore. The two not only have significant differences in market cap ranking, application scenarios, and price performance, but also represent different positioning in crypto assets.
SATS (SATS): Since its launch, it has gained market recognition as a BRC-20 token.
Bitcoin (BTC): Since 2008, it has been hailed as "digital gold" and is one of the cryptocurrencies with the highest global trading volume and market capitalization.
This article will comprehensively analyze the investment value comparison between SATS vs BTC, focusing on historical price trends, supply mechanisms, institutional adoption, technological ecosystems, and future predictions, attempting to answer the question most concerning to investors:
"Which is the better buy right now?"
I. Price History Comparison and Current Market Status
SATS and BTC Historical Price Trends
- 2023: SATS launched as a BRC-20 token on Bitcoin, price fluctuated significantly.
- 2024: BTC reached new all-time high of $126,080 after spot ETF approval, price surged.
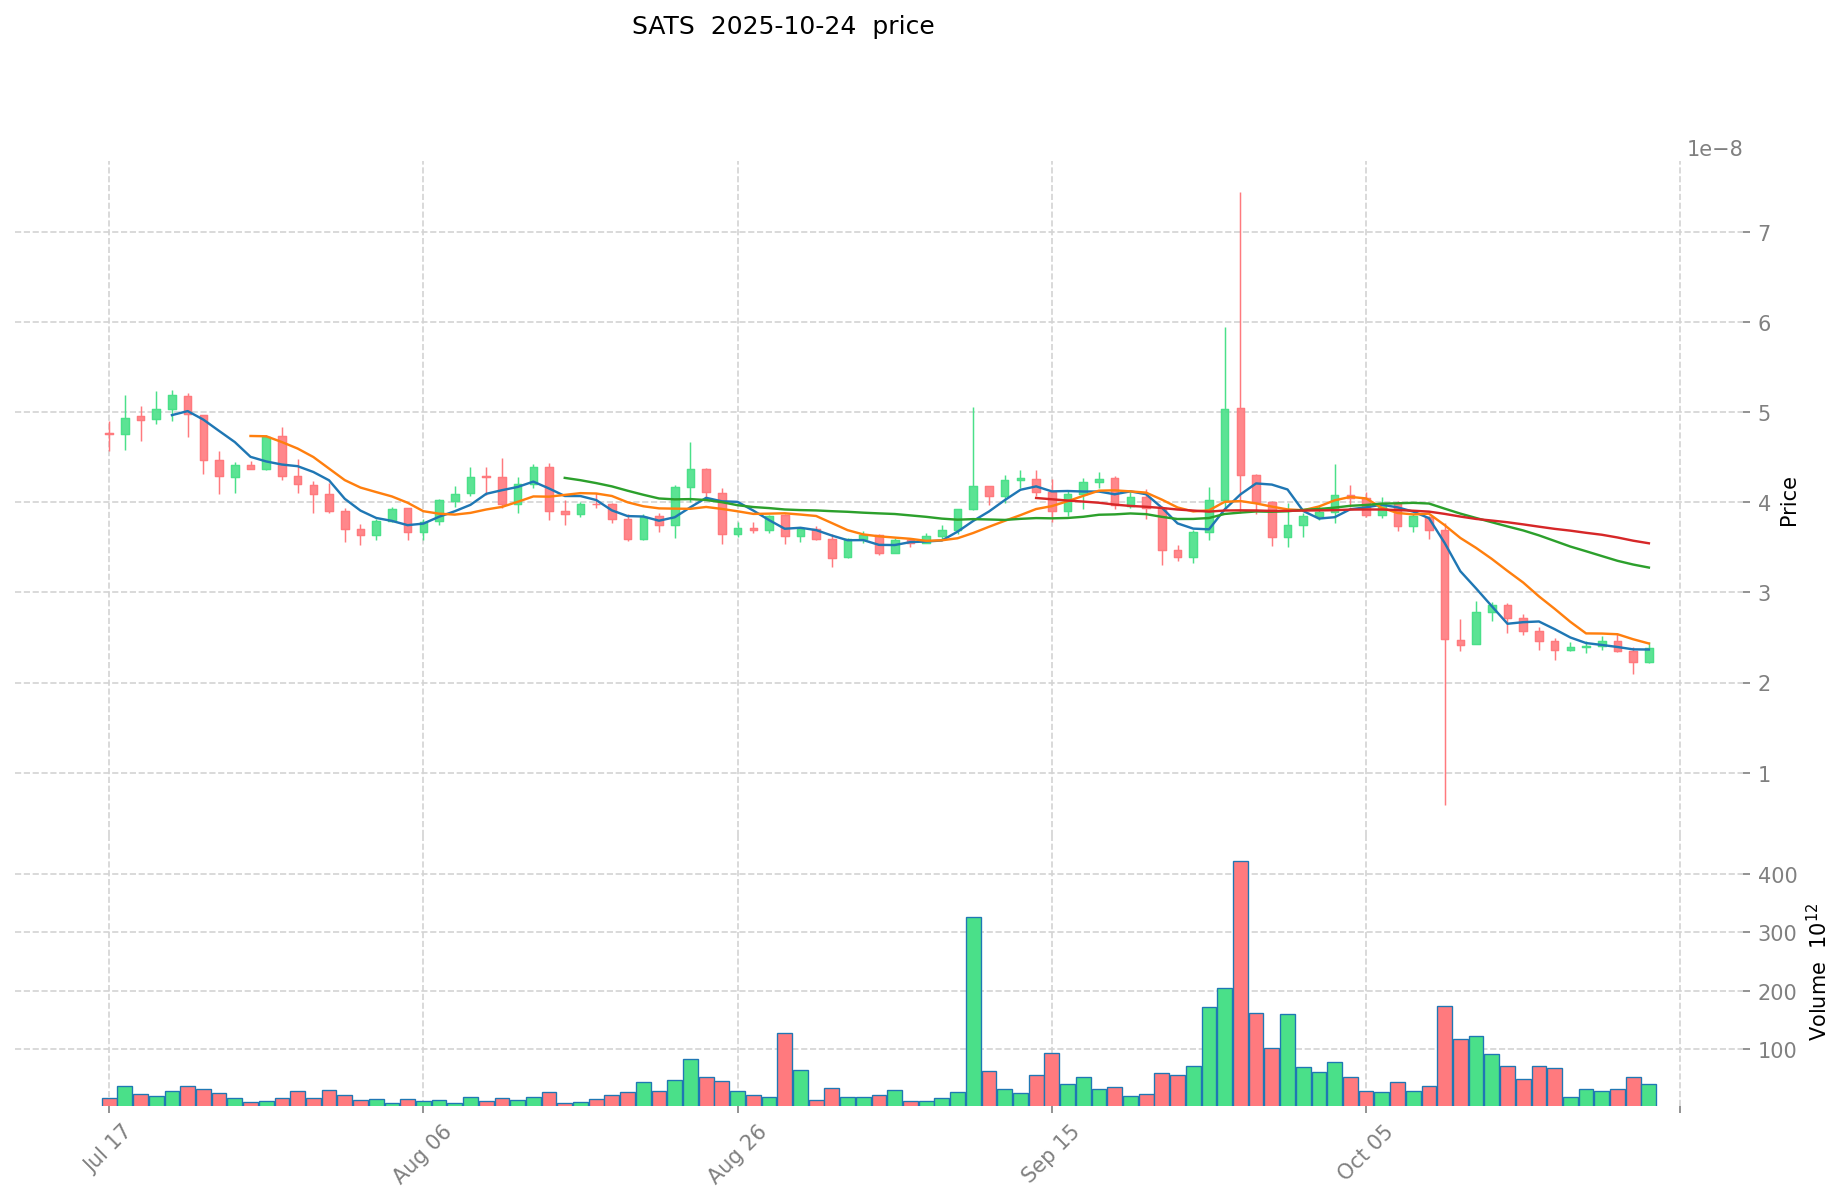
- Comparative analysis: In the recent market cycle, SATS dropped from $0.000000941 to $0.00000002383, while BTC rose from around $30,000 to over $100,000.
Current Market Situation (2025-10-24)
- SATS current price: $0.00000002383
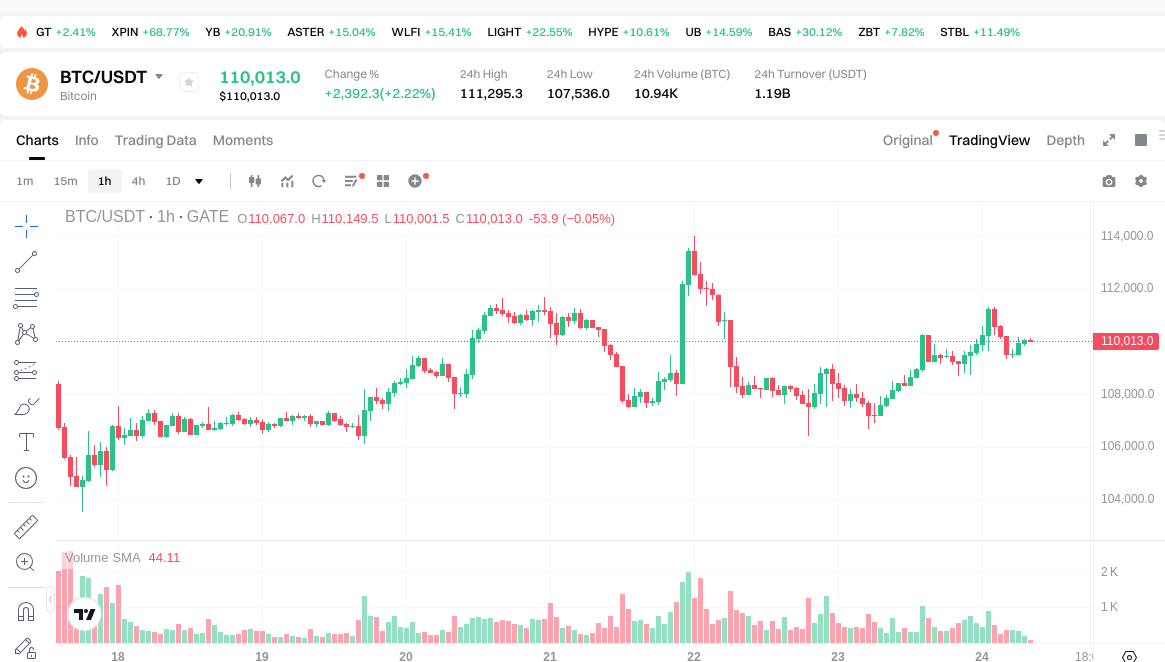
- BTC current price: $109,981.6
- 24-hour trading volume: SATS $931,683 vs BTC $1,198,834,741
- Market Sentiment Index (Fear & Greed Index): 27 (Fear)
Click to view real-time prices:
- View SATS current price Market Price
- View BTC current price Market Price
II. Core Factors Influencing SATS vs BTC Investment Value
Supply Mechanism Comparison (Tokenomics)
- SATS: Built on the "Satoshi Standard," binding assets to Bitcoin's smallest unit, inherently scarce as 1 BTC = 100 million sats
- BTC: Fixed supply capped at 21 million coins with halving mechanism reducing new supply every four years
- 📌 Historical Pattern: Both assets share the same fundamental scarcity, with SATS representing fractional ownership of Bitcoin's fixed supply, potentially making investments psychologically more accessible.
Institutional Adoption and Market Applications
- Institutional Holdings: BTC currently dominates institutional portfolios, while SATS is emerging as a derivative asset in the Bitcoin ecosystem
- Enterprise Adoption: BTC serves as a treasury reserve asset and settlement layer, while SATS offers potential advantages for micropayments and everyday transactions due to smaller denomination
- Regulatory Attitudes: Regulatory frameworks primarily focus on BTC as the main asset, with SATS existing within the same regulatory environment
Technical Development and Ecosystem Building
- SATS Technical Framework: Based on BRC-20 token standard, leveraging Bitcoin's security while facing potential liquidity bottlenecks
- BTC Technical Development: Ongoing improvements through Taproot Assets Protocol, Lightning Network integration, and low transaction costs
- Ecosystem Comparison: BTC has broader integration across financial services, while SATS is positioned within Bitcoin's ecosystem with potential for specialized micropayment applications
Macroeconomic Factors and Market Cycles
- Inflation Response: Both share Bitcoin's anti-inflationary properties, with SATS potentially making fractional ownership more accessible
- Monetary Policy Impact: Central bank policies affecting risk assets impact both similarly, with BTC serving as the primary benchmark
- Geopolitical Factors: Community support and network effects are critical success factors for SATS, while BTC has established itself as a global alternative asset
III. 2025-2030 Price Prediction: SATS vs BTC
Short-term Prediction (2025)
- SATS: Conservative 0.000000014286 - 0.00000002381 | Optimistic 0.00000002381 - 0.0000000295244
- BTC: Conservative $88,073.6 - $110,092 | Optimistic $110,092 - $128,807.64
Mid-term Prediction (2027)
- SATS may enter a growth phase, with prices estimated between 0.000000016992339 - 0.000000032832656
- BTC may enter a bullish market, with prices estimated between $129,005.8056 - $200,675.6976
- Key drivers: Institutional capital inflow, ETF, ecosystem development
Long-term Prediction (2030)
- SATS: Base scenario 0.000000026042082 - 0.000000041336638 | Optimistic scenario 0.000000041336638 - 0.000000047537134
- BTC: Base scenario $155,464.89632856 - $207,286.52843808 | Optimistic scenario $207,286.52843808 - $221,796.5854287456
Disclaimer
SATS:
| 年份 | 预测最高价 | 预测平均价格 | 预测最低价 | 涨跌幅 |
|---|---|---|---|---|
| 2025 | 0.0000000295244 | 0.00000002381 | 0.000000014286 | 0 |
| 2026 | 0.000000030933952 | 0.0000000266672 | 0.000000021600432 | 11 |
| 2027 | 0.000000032832656 | 0.000000028800576 | 0.000000016992339 | 20 |
| 2028 | 0.000000044684093 | 0.000000030816616 | 0.000000025885957 | 29 |
| 2029 | 0.000000044922922 | 0.000000037750355 | 0.00000003510783 | 58 |
| 2030 | 0.000000047537134 | 0.000000041336638 | 0.000000026042082 | 73 |
BTC:
| 年份 | 预测最高价 | 预测平均价格 | 预测最低价 | 涨跌幅 |
|---|---|---|---|---|
| 2025 | 128807.64 | 110092 | 88073.6 | 0 |
| 2026 | 167229.748 | 119449.82 | 91976.3614 | 8 |
| 2027 | 200675.6976 | 143339.784 | 129005.8056 | 30 |
| 2028 | 182328.205248 | 172007.7408 | 139326.270048 | 56 |
| 2029 | 237405.08385216 | 177167.973024 | 152364.45680064 | 61 |
| 2030 | 221796.5854287456 | 207286.52843808 | 155464.89632856 | 88 |
IV. Investment Strategy Comparison: SATS vs BTC
Long-term vs Short-term Investment Strategies
- SATS: Suitable for investors focusing on micropayment scenarios and ecosystem potential
- BTC: Suitable for investors seeking stability and inflation-hedge properties
Risk Management and Asset Allocation
- Conservative investors: SATS: 5% vs BTC: 95%
- Aggressive investors: SATS: 20% vs BTC: 80%
- Hedging tools: Stablecoin allocation, options, cross-currency portfolios
V. Potential Risk Comparison
Market Risk
- SATS: High volatility due to lower liquidity and market cap
- BTC: Susceptible to macroeconomic factors and institutional sentiment
Technical Risk
- SATS: Scalability issues, network stability dependent on BRC-20 standard
- BTC: Mining centralization, potential security vulnerabilities
Regulatory Risk
- Global regulatory policies may have differing impacts on both assets
VI. Conclusion: Which Is the Better Buy?
📌 Investment Value Summary:
- SATS advantages: Potential for micro-transactions, psychological accessibility for fractional ownership
- BTC advantages: Established market leader, institutional adoption, proven track record
✅ Investment Advice:
- Novice investors: Consider a small allocation to SATS within a BTC-dominated portfolio
- Experienced investors: Explore SATS for potential growth while maintaining a core BTC position
- Institutional investors: Focus primarily on BTC with potential small-scale experimentation with SATS
⚠️ Risk Warning: The cryptocurrency market is highly volatile. This article does not constitute investment advice. None
FAQ
Q1: What is the main difference between SATS and BTC? A: SATS is a BRC-20 token built on Bitcoin, representing its smallest unit (1 BTC = 100 million sats), while BTC is the original cryptocurrency with a fixed supply of 21 million coins.
Q2: Which asset has shown better price performance recently? A: BTC has shown better price performance, reaching a new all-time high of $126,080 in 2024, while SATS has experienced significant price fluctuations since its launch.
Q3: How do the supply mechanisms of SATS and BTC compare? A: Both assets share the same fundamental scarcity. SATS is bound to Bitcoin's smallest unit, while BTC has a fixed supply cap of 21 million coins with a halving mechanism every four years.
Q4: What are the key factors influencing the investment value of SATS and BTC? A: Key factors include supply mechanisms, institutional adoption, technical development, ecosystem building, and macroeconomic factors such as inflation and monetary policy.
Q5: What are the long-term price predictions for SATS and BTC by 2030? A: For SATS, the base scenario predicts 0.000000026042082 - 0.000000041336638, with an optimistic scenario of 0.000000041336638 - 0.000000047537134. For BTC, the base scenario predicts $155,464.89632856 - $207,286.52843808, with an optimistic scenario of $207,286.52843808 - $221,796.5854287456.
Q6: How should investors allocate their portfolios between SATS and BTC? A: Conservative investors might consider 5% SATS and 95% BTC, while aggressive investors might opt for 20% SATS and 80% BTC. However, individual risk tolerance and investment goals should guide allocation decisions.
Q7: What are the main risks associated with investing in SATS and BTC? A: SATS faces high volatility due to lower liquidity and market cap, as well as potential scalability issues. BTC is susceptible to macroeconomic factors, institutional sentiment, and concerns about mining centralization. Both assets are subject to regulatory risks.
Share
Content
Introduction: Investment Comparison of SATS vs BTC
I. Price History Comparison and Current Market Status
II. Core Factors Influencing SATS vs BTC Investment Value
III. 2025-2030 Price Prediction: SATS vs BTC
IV. Investment Strategy Comparison: SATS vs BTC
V. Potential Risk Comparison
VI. Conclusion: Which Is the Better Buy?
FAQ

