RIF vs ENJ: Comparing Two Leading Blockchain Gaming Platforms
Introduction: RIF vs ENJ Investment Comparison
In the cryptocurrency market, RIF vs ENJ comparison has always been a topic that investors cannot ignore. The two not only have significant differences in market cap ranking, application scenarios, and price performance, but also represent different cryptocurrency asset positioning.
RIF (RIF): Since its launch in 2018, it has gained market recognition for its blockchain infrastructure framework.
ENJ (ENJ): Launched in 2017, it has been hailed as a leading platform for gaming and virtual goods, becoming one of the most traded and valuable cryptocurrencies in the gaming sector.
This article will comprehensively analyze the investment value comparison between RIF and ENJ, focusing on historical price trends, supply mechanisms, institutional adoption, technological ecosystems, and future predictions, and attempt to answer the question that investors are most concerned about:
"Which is the better buy right now?"
I. Price History Comparison and Current Market Status
RIF and ENJ Historical Price Trends
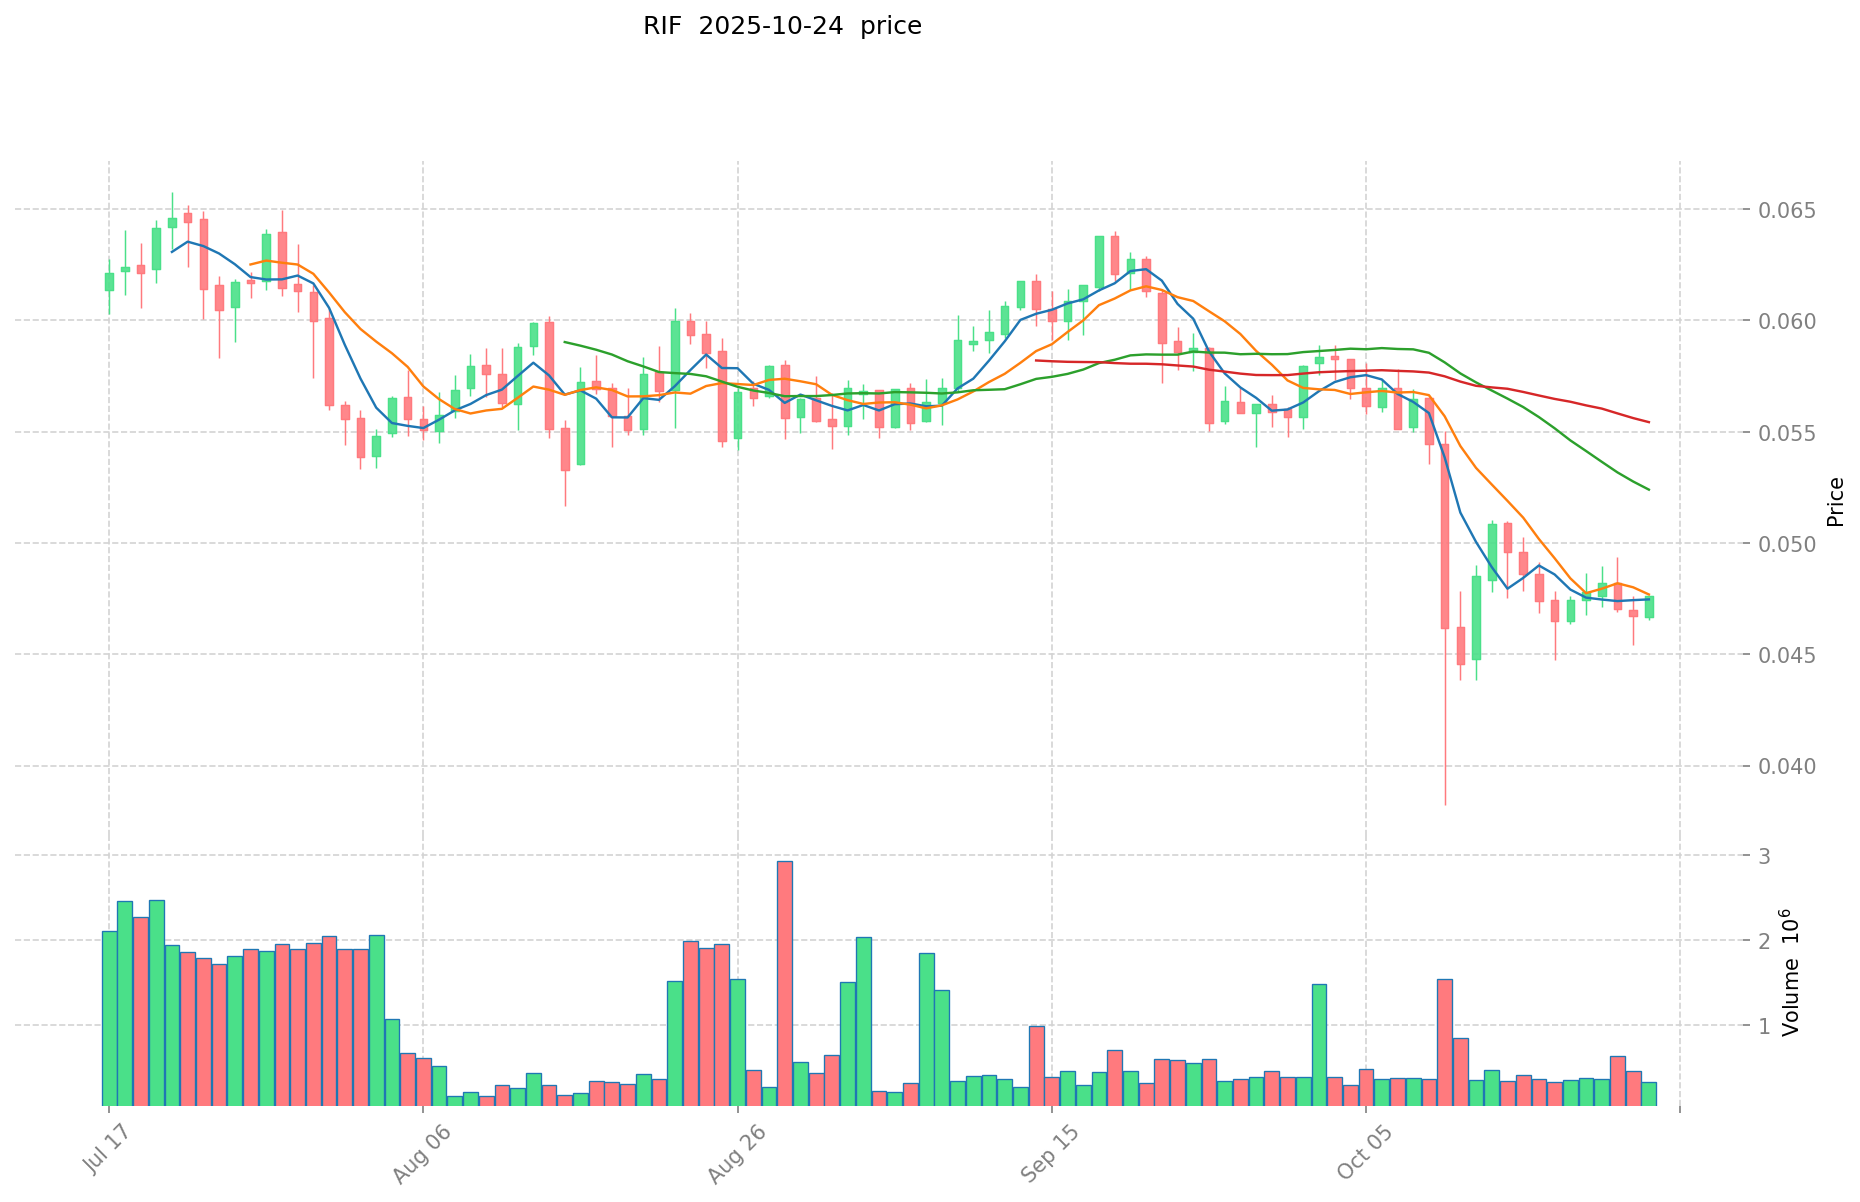
- 2021: RIF reached its all-time high of $0.455938 on April 13, 2021.
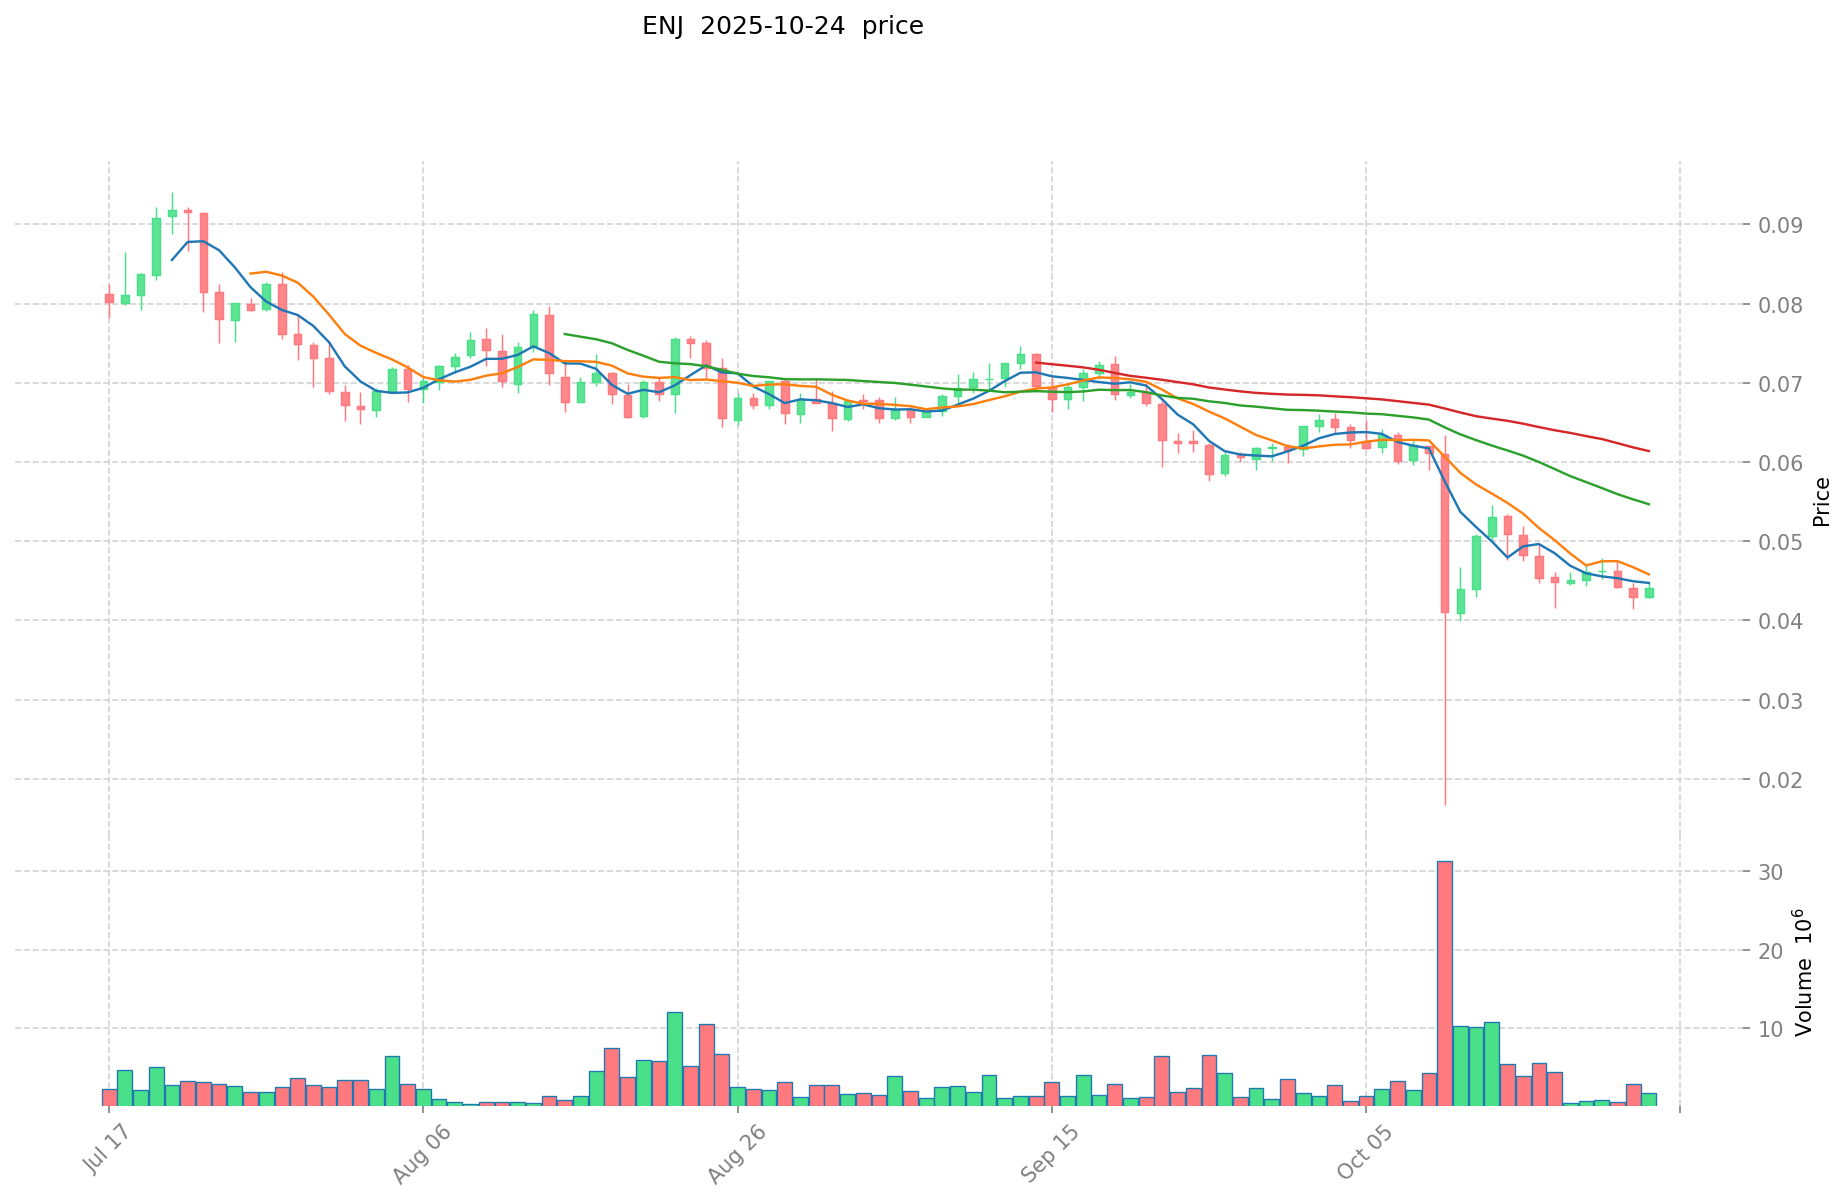
- 2021: ENJ hit its all-time high of $4.82 on November 25, 2021, driven by the NFT and gaming boom.
- Comparative analysis: In the recent market cycle, RIF dropped from its high of $0.455938 to a current price of $0.04761, while ENJ fell from $4.82 to $0.04421.
Current Market Situation (2025-10-24)
- RIF current price: $0.04761
- ENJ current price: $0.04421
- 24-hour trading volume: RIF $15,835.84 vs ENJ $78,384.03
- Market Sentiment Index (Fear & Greed Index): 27 (Fear)
Click to view real-time prices:
- View RIF current price Market Price
- View ENJ current price Market Price
II. Project Overview and Technology Comparison
RIF (RIF Token)
- Full name: RSK Infrastructure Framework
- Launch date: November 9, 2018
- Key features:
- Designed as a utility token for the RSK Infrastructure Framework
- Aims to enable seamless integration of decentralized infrastructure services
- Focuses on scalability and interoperability within the Bitcoin ecosystem
ENJ (Enjin Coin)
- Full name: Enjin Coin
- Launch date: November 1, 2017
- Key features:
- Specialized in gaming and NFT applications
- Provides tools for creating, managing, and trading virtual goods
- Supports the creation of blockchain-based gaming ecosystems
Technology Comparison
- Blockchain: RIF operates on the RSK sidechain, while ENJ is primarily based on Ethereum
- Consensus mechanism: RIF utilizes merge-mining with Bitcoin, ENJ relies on Ethereum's consensus
- Scalability solutions: RIF leverages RSK's scalability features, ENJ is exploring layer-2 solutions
III. Market Performance and Investment Analysis
Market Cap and Ranking
- RIF: Market cap $47,610,000, ranked #639
- ENJ: Market cap $83,758,286, ranked #453
Recent Price Trends
- RIF:
- 24h: +2.05%
- 7d: +0.38%
- 30d: -18.70%
- ENJ:
- 24h: +3.00%
- 7d: -2.73%
- 30d: -29.38%
Trading Volume and Liquidity
- RIF 24h trading volume: $15,835.84
- ENJ 24h trading volume: $78,384.03
- Analysis: ENJ shows significantly higher trading volume, indicating better liquidity
Investment Considerations
- Risk factors:
- Both tokens have experienced substantial price declines from their all-time highs
- Market sentiment is currently fearful, suggesting potential further downside
- Potential opportunities:
- RIF's integration with Bitcoin ecosystem could provide long-term value
- ENJ's focus on gaming and NFTs aligns with growing trends in blockchain adoption
IV. Future Outlook and Development Roadmap
RIF Token (RIF)
- Ongoing development of RSK Infrastructure Framework
- Potential for increased adoption within the Bitcoin ecosystem
Enjin Coin (ENJ)
- Continued focus on gaming and NFT applications
- Exploration of new blockchain gaming use cases and partnerships
Industry Trends
- Growing interest in Bitcoin-based smart contract platforms
- Increasing adoption of blockchain technology in gaming and digital asset management
V. Conclusion and Investment Suggestions
- Both RIF and ENJ have shown significant volatility and are currently trading well below their all-time highs
- RIF may appeal to investors interested in Bitcoin ecosystem development
- ENJ could attract those focusing on blockchain gaming and NFT trends
- Given the current fearful market sentiment, cautious investment approaches are advised
- Diversification and thorough research are crucial before making any investment decisions
Disclaimer: This report is for informational purposes only and should not be considered as financial advice. Always conduct your own research and consult with a qualified financial advisor before making any investment decisions.
II. Core Factors Affecting RIF vs ENJ Investment Value
Supply Mechanism Comparison (Tokenomics)
- RIF: Limited supply mechanism influenced by market rates and economic trends
- ENJ: Gaming-focused token with market volatility considerations
- 📌 Historical Pattern: Supply mechanisms show correlation with market cycles and sentiment fluctuations.
Institutional Adoption and Market Applications
- Institutional Holdings: Investment decisions influenced by project utility, team background, and market environment
- Enterprise Adoption: Both tokens face volatility risks while offering different utility propositions
- National Policies: Regulatory policies and international economic environments affect value stability
Technical Development and Ecosystem Building
- Project Utility: Investment value closely tied to practical applications and use cases
- Community Support: Strong community backing contributes to long-term value proposition
- Ecosystem Comparison: Different focus areas with varying implementation success rates
Macroeconomic Factors and Market Cycles
- Performance in Inflationary Environments: Both subject to high volatility in changing economic conditions
- Monetary Policy Impact: Interest rates and market sentiment significantly influence pricing
- Geopolitical Factors: Broader market environment and risk appetite affect investment decisions
III. 2025-2030 Price Prediction: RIF vs ENJ
Short-term Prediction (2025)
- RIF: Conservative $0.0438 - $0.0476 | Optimistic $0.0476 - $0.0524
- ENJ: Conservative $0.0261 - $0.0442 | Optimistic $0.0442 - $0.0552
Mid-term Prediction (2027)
- RIF may enter a growth phase, with estimated prices $0.0462 - $0.0796
- ENJ may enter a growth phase, with estimated prices $0.0393 - $0.0797
- Key drivers: Institutional capital inflow, ETF, ecosystem development
Long-term Prediction (2030)
- RIF: Base scenario $0.0855 - $0.0961 | Optimistic scenario $0.0961 - $0.1061
- ENJ: Base scenario $0.0792 - $0.0887 | Optimistic scenario $0.0887 - $0.0982
Disclaimer
RIF:
| 年份 | 预测最高价 | 预测平均价格 | 预测最低价 | 涨跌幅 |
|---|---|---|---|---|
| 2025 | 0.052393 | 0.04763 | 0.0438196 | 0 |
| 2026 | 0.057513225 | 0.0500115 | 0.028506555 | 5 |
| 2027 | 0.0795682965 | 0.0537623625 | 0.04623563175 | 12 |
| 2028 | 0.09866468766 | 0.0666653295 | 0.04266581088 | 40 |
| 2029 | 0.0884515591806 | 0.08266500858 | 0.0462924048048 | 73 |
| 2030 | 0.106092272011572 | 0.0855582838803 | 0.057324050199801 | 79 |
ENJ:
| 年份 | 预测最高价 | 预测平均价格 | 预测最低价 | 涨跌幅 |
|---|---|---|---|---|
| 2025 | 0.0552 | 0.04416 | 0.0260544 | 0 |
| 2026 | 0.0675648 | 0.04968 | 0.03726 | 12 |
| 2027 | 0.079726464 | 0.0586224 | 0.039277008 | 32 |
| 2028 | 0.0760918752 | 0.069174432 | 0.03527896032 | 56 |
| 2029 | 0.085707121248 | 0.0726331536 | 0.05810652288 | 64 |
| 2030 | 0.09817097040576 | 0.079170137424 | 0.0712531236816 | 79 |
IV. Investment Strategy Comparison: RIF vs ENJ
Long-term vs Short-term Investment Strategies
- RIF: Suitable for investors focused on Bitcoin ecosystem development and infrastructure
- ENJ: Suitable for investors interested in gaming and NFT market potential
Risk Management and Asset Allocation
- Conservative investors: RIF: 40% vs ENJ: 60%
- Aggressive investors: RIF: 55% vs ENJ: 45%
- Hedging tools: Stablecoin allocation, options, cross-currency portfolios
V. Potential Risk Comparison
Market Risk
- RIF: Volatility tied to Bitcoin ecosystem adoption and development
- ENJ: Susceptibility to gaming and NFT market trends
Technical Risk
- RIF: Scalability, network stability within RSK ecosystem
- ENJ: Smart contract vulnerabilities, Ethereum network congestion
Regulatory Risk
- Global regulatory policies may impact both tokens differently, with gaming-focused ENJ potentially facing more scrutiny
VI. Conclusion: Which Is the Better Buy?
📌 Investment Value Summary:
- RIF advantages: Bitcoin ecosystem integration, potential for infrastructure adoption
- ENJ advantages: Strong position in gaming and NFT markets, higher liquidity
✅ Investment Advice:
- Novice investors: Consider a balanced approach with a slight preference for ENJ due to higher liquidity
- Experienced investors: Evaluate based on personal risk tolerance and belief in respective ecosystems
- Institutional investors: Consider RIF for Bitcoin ecosystem exposure, ENJ for gaming and NFT sector representation
⚠️ Risk Warning: Cryptocurrency markets are highly volatile. This article does not constitute investment advice. None
VII. FAQ
Q1: What are the main differences between RIF and ENJ? A: RIF focuses on the Bitcoin ecosystem and infrastructure development, while ENJ specializes in gaming and NFT applications. RIF operates on the RSK sidechain, whereas ENJ is primarily based on Ethereum.
Q2: Which token has shown better price performance recently? A: Based on recent data, RIF has shown slightly better short-term performance with a 7-day increase of +0.38%, while ENJ decreased by -2.73% over the same period. However, both tokens have experienced significant declines from their all-time highs.
Q3: How do the market capitalizations and rankings of RIF and ENJ compare? A: ENJ has a higher market capitalization of $83,758,286 and is ranked #453, while RIF has a market cap of $47,610,000 and is ranked #639.
Q4: What are the key factors affecting the investment value of RIF and ENJ? A: Key factors include supply mechanisms, institutional adoption, technical development, ecosystem building, macroeconomic conditions, and market cycles. Both tokens are influenced by their respective focus areas: Bitcoin ecosystem for RIF and gaming/NFTs for ENJ.
Q5: What are the long-term price predictions for RIF and ENJ? A: By 2030, the base scenario predicts RIF to be between $0.0855 - $0.0961, and ENJ between $0.0792 - $0.0887. In an optimistic scenario, RIF could reach $0.0961 - $0.1061, and ENJ $0.0887 - $0.0982.
Q6: How should investors allocate their assets between RIF and ENJ? A: For conservative investors, a suggested allocation is 40% RIF and 60% ENJ. For aggressive investors, the recommendation is 55% RIF and 45% ENJ. However, individual allocations should be based on personal risk tolerance and market analysis.
Q7: What are the main risks associated with investing in RIF and ENJ? A: Both tokens face market risks due to crypto volatility. RIF's risks are tied to Bitcoin ecosystem adoption, while ENJ's risks are linked to gaming and NFT market trends. Technical risks include scalability issues for RIF and smart contract vulnerabilities for ENJ. Both also face potential regulatory risks, with ENJ possibly facing more scrutiny in the gaming sector.
Share
Content
Introduction: RIF vs ENJ Investment Comparison
I. Price History Comparison and Current Market Status
II. Project Overview and Technology Comparison
III. Market Performance and Investment Analysis
IV. Future Outlook and Development Roadmap
V. Conclusion and Investment Suggestions
II. Core Factors Affecting RIF vs ENJ Investment Value
III. 2025-2030 Price Prediction: RIF vs ENJ
IV. Investment Strategy Comparison: RIF vs ENJ
V. Potential Risk Comparison
VI. Conclusion: Which Is the Better Buy?
VII. FAQ

