Q vs LINK: Comparing Two Cutting-Edge Blockchain Technologies for Enterprise Solutions
Introduction: Investment Comparison of Q vs LINK
In the cryptocurrency market, the comparison between Quack AI (Q) and ChainLink (LINK) has been an unavoidable topic for investors. The two not only show significant differences in market cap ranking, application scenarios, and price performance but also represent different positioning in crypto assets.
Quack AI (Q): Since its launch, it has gained market recognition for its AI-native governance layer for Web3.
ChainLink (LINK): Since 2017, it has been hailed as a decentralized oracle network, becoming one of the cryptocurrencies with the highest global trading volume and market capitalization.
This article will comprehensively analyze the investment value comparison between Q and LINK, focusing on historical price trends, supply mechanisms, institutional adoption, technological ecosystems, and future predictions, attempting to answer the question investors care about most:
"Which is the better buy right now?"
I. Price History Comparison and Current Market Status
Quack AI (Q) and Chainlink (LINK) Historical Price Trends
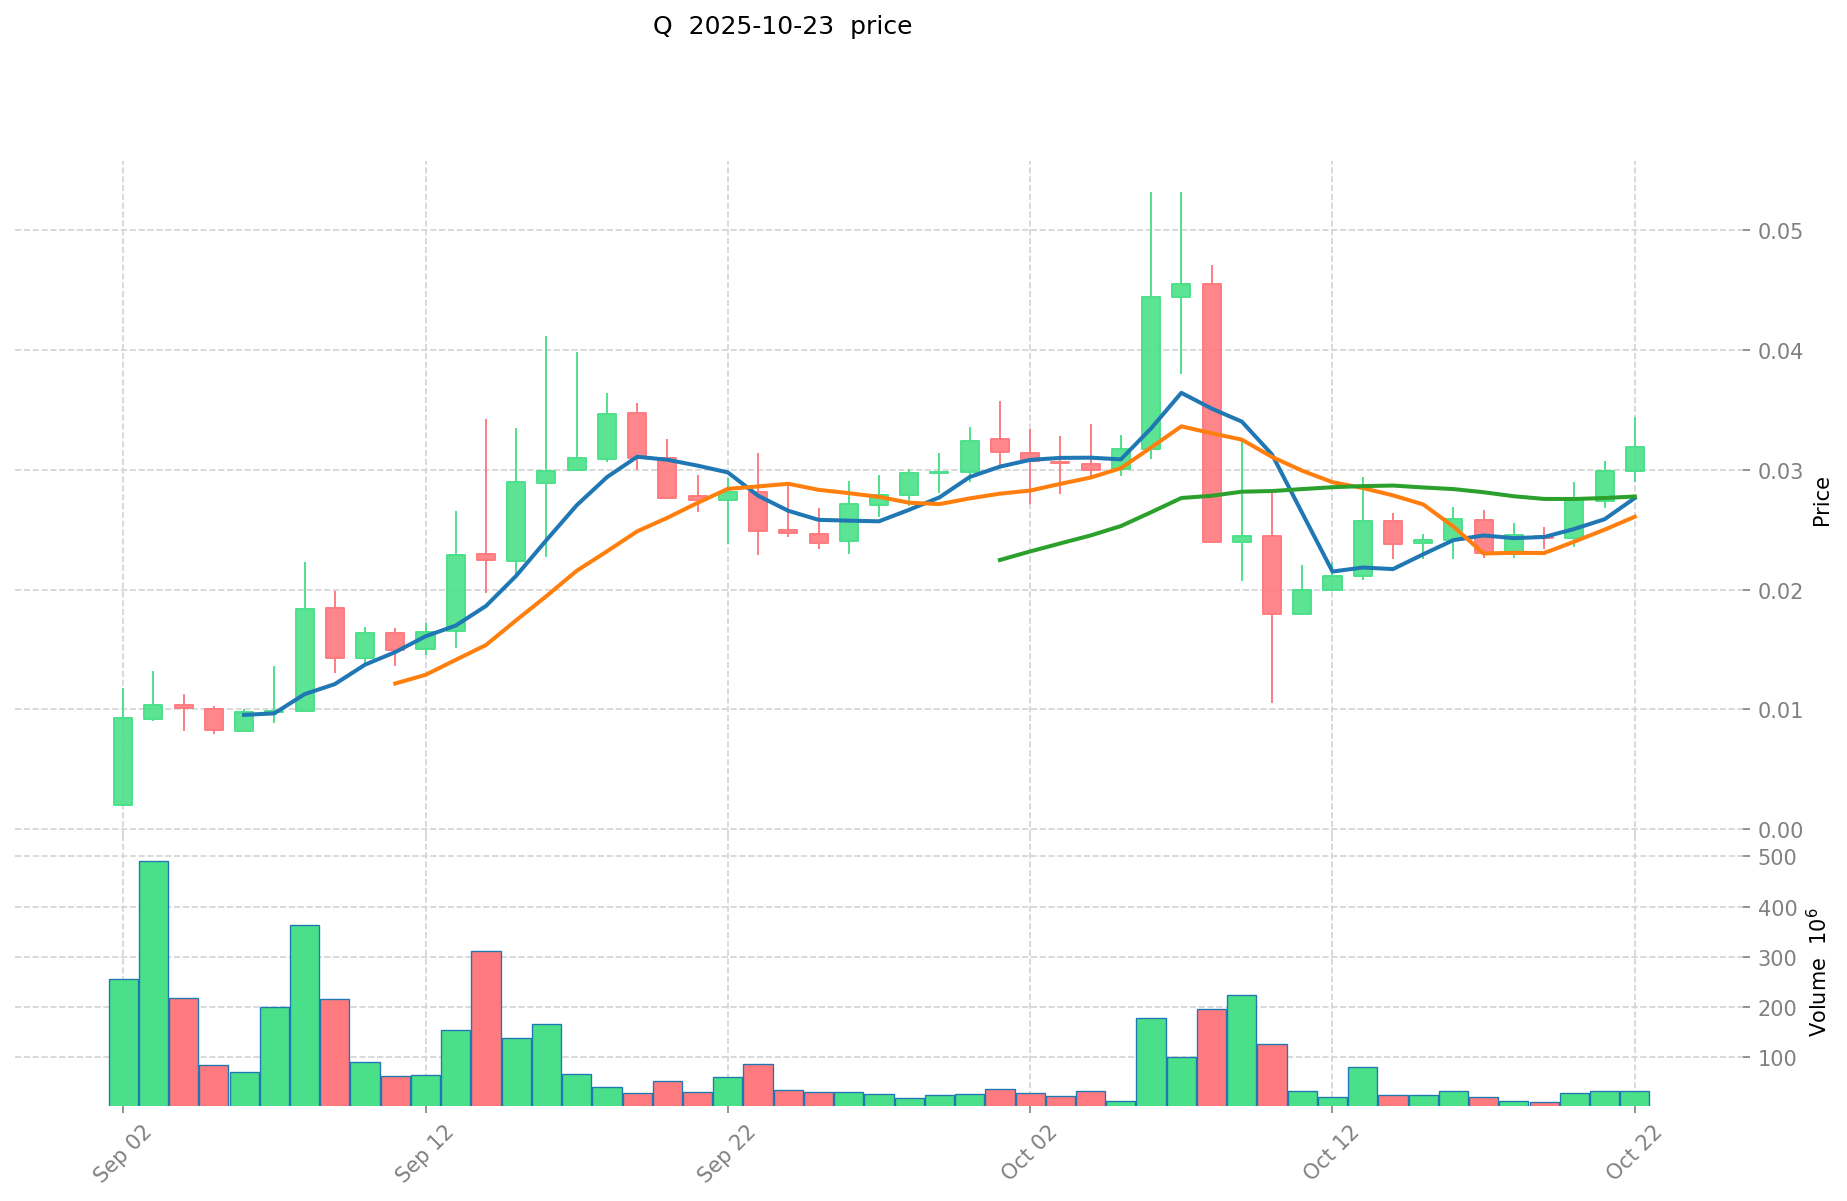
- 2025: Quack AI reached its all-time high of $0.053205 on October 7, due to increased adoption of its AI governance solutions.
- 2021: Chainlink hit its all-time high of $52.70 on May 10, driven by the DeFi boom and increased demand for oracle services.
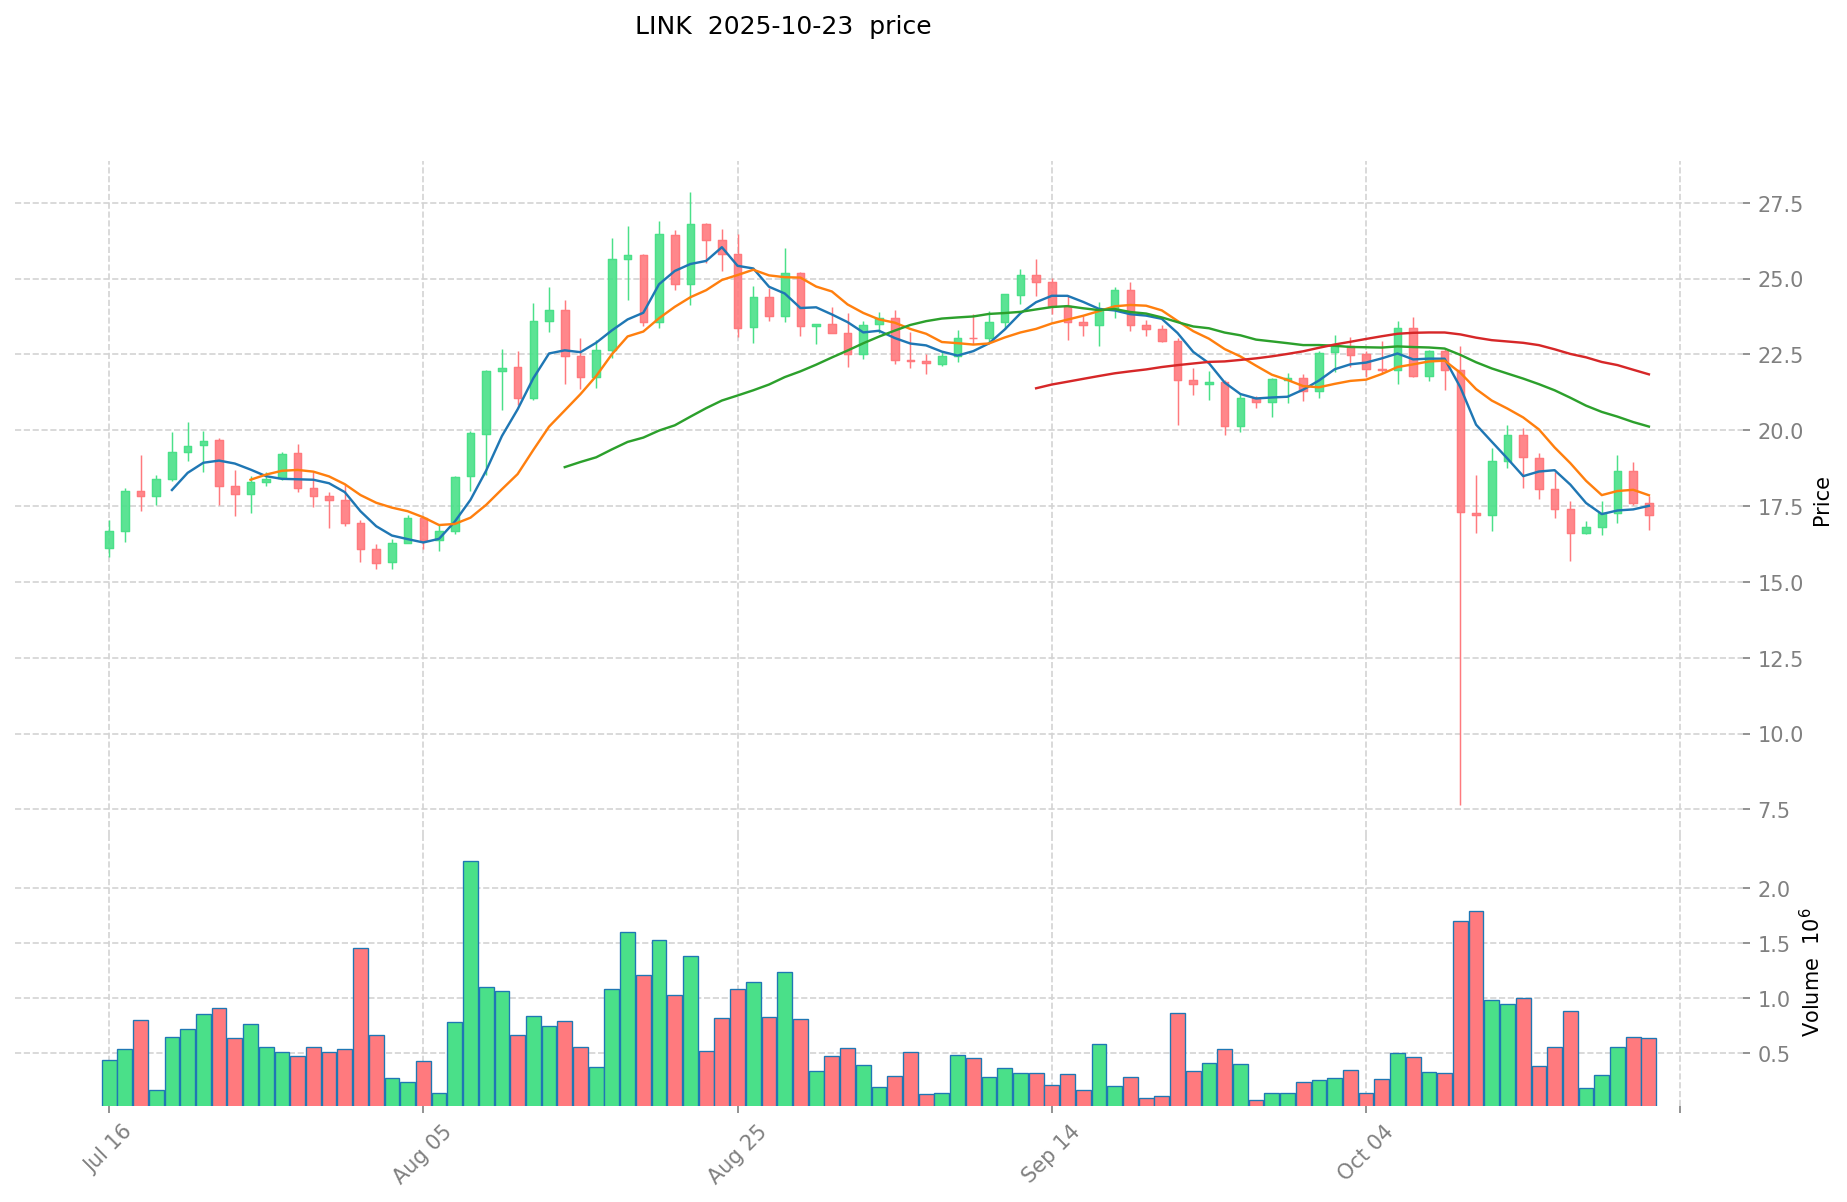
- Comparative analysis: In the recent market cycle, Quack AI dropped from its ATH of $0.053205 to a low of $0.002, while Chainlink declined from its ATH of $52.70 to current levels around $17.
Current Market Situation (2025-10-23)
- Quack AI current price: $0.032215
- Chainlink current price: $17.211
- 24-hour trading volume: $1,064,005 (Q) vs $11,023,290 (LINK)
- Market Sentiment Index (Fear & Greed Index): 27 (Fear)
Click to view real-time prices:
- Check Q current price Market Price
- Check LINK current price Market Price
Key Factors Affecting Investment Value of Q vs LINK
Supply Mechanisms Comparison (Tokenomics)
- Q: Limited supply model with potential deflationary characteristics
- LINK: Structured distribution mechanism with network growth correlation
- 📌 Historical pattern: Supply mechanisms have historically driven cyclical price movements in both assets, with scarcity creating upward pressure during adoption phases.
Institutional Adoption and Market Applications
- Institutional holdings: Risk assessment plays a crucial role in institutional allocation decisions for both assets
- Enterprise adoption: Q and LINK offer different value propositions in cross-border settlements and investment portfolio diversification
- Regulatory landscape: Global regulatory frameworks continue to evolve, with varying approaches to both assets across jurisdictions
Technical Development and Ecosystem Building
- Q technical upgrades: Focused on enterprise fundamentals and market integration capabilities
- LINK technical development: Emphasis on infrastructure solutions and value chain connectivity
- Ecosystem comparison: Both assets demonstrate varying degrees of integration across DeFi, payments, and smart contract applications
Macroeconomic Factors and Market Cycles
- Performance during inflation: Global value chain developments influence how both assets respond to inflationary pressures
- Macroeconomic monetary policies: Interest rates and USD index movements create different correlation patterns for Q vs LINK
- Geopolitical factors: Cross-border transaction demands and international situations affect both assets' utility and adoption rates
III. 2025-2030 Price Prediction: Q vs LINK
Short-term Prediction (2025)
- Q: Conservative $0.01664104 - $0.032002 | Optimistic $0.032002 - $0.03904244
- LINK: Conservative $11.53807 - $17.221 | Optimistic $17.221 - $24.79824
Mid-term Prediction (2027)
- Q may enter a growth phase, with projected prices ranging from $0.034264733412 to $0.044431192776
- LINK may enter a bullish market, with projected prices ranging from $16.246739146 to $31.176175118
- Key drivers: Institutional capital inflow, ETF developments, ecosystem growth
Long-term Prediction (2030)
- Q: Base scenario $0.046301953086412 - $0.066211792913569 | Optimistic scenario $0.066211792913569+
- LINK: Base scenario $31.4138385656425 - $43.036958834930225 | Optimistic scenario $43.036958834930225+
Disclaimer: This analysis is based on historical data and market projections. Cryptocurrency markets are highly volatile and unpredictable. This information should not be considered as financial advice. Always conduct your own research before making investment decisions.
Q:
| 年份 | 预测最高价 | 预测平均价格 | 预测最低价 | 涨跌幅 |
|---|---|---|---|---|
| 2025 | 0.03904244 | 0.032002 | 0.01664104 | 0 |
| 2026 | 0.0397848864 | 0.03552222 | 0.0237998874 | 10 |
| 2027 | 0.044431192776 | 0.0376535532 | 0.034264733412 | 16 |
| 2028 | 0.04391533909716 | 0.041042372988 | 0.02914008482148 | 27 |
| 2029 | 0.050125050130244 | 0.04247885604258 | 0.028036044988102 | 31 |
| 2030 | 0.066211792913569 | 0.046301953086412 | 0.041208738246906 | 43 |
LINK:
| 年份 | 预测最高价 | 预测平均价格 | 预测最低价 | 涨跌幅 |
|---|---|---|---|---|
| 2025 | 24.79824 | 17.221 | 11.53807 | 0 |
| 2026 | 22.9004858 | 21.00962 | 13.0259644 | 22 |
| 2027 | 31.176175118 | 21.9550529 | 16.246739146 | 27 |
| 2028 | 31.8787368108 | 26.565614009 | 13.54846314459 | 54 |
| 2029 | 33.605501721385 | 29.2221754099 | 18.117748754138 | 69 |
| 2030 | 43.036958834930225 | 31.4138385656425 | 16.649334439790525 | 82 |
IV. Investment Strategy Comparison: Q vs LINK
Long-term vs Short-term Investment Strategies
- Q: Suitable for investors focused on AI governance solutions and ecosystem potential
- LINK: Suitable for investors seeking established infrastructure and DeFi integration
Risk Management and Asset Allocation
- Conservative investors: Q: 20% vs LINK: 80%
- Aggressive investors: Q: 40% vs LINK: 60%
- Hedging tools: Stablecoin allocation, options, cross-currency portfolios
V. Potential Risk Comparison
Market Risks
- Q: Higher volatility due to newer market positioning
- LINK: Dependency on overall DeFi and smart contract market health
Technical Risks
- Q: Scalability, network stability
- LINK: Oracle security, network congestion
Regulatory Risks
- Global regulatory policies may impact both assets differently, with potential for increased scrutiny on AI-related technologies
VI. Conclusion: Which Is the Better Buy?
📌 Investment Value Summary:
- Q advantages: AI-native governance, potential for rapid growth in emerging Web3 AI sector
- LINK advantages: Established market position, wide adoption in DeFi and smart contract ecosystems
✅ Investment Advice:
- New investors: Consider a balanced approach, leaning towards LINK for stability
- Experienced investors: Explore strategic allocation to both, with higher risk tolerance for Q
- Institutional investors: Evaluate Q for long-term potential, maintain LINK exposure for established market presence
⚠️ Risk Warning: Cryptocurrency markets are highly volatile. This article does not constitute investment advice. None
FAQ
Q1: What are the main differences between Quack AI (Q) and ChainLink (LINK)? A: Quack AI (Q) is an AI-native governance layer for Web3, while ChainLink (LINK) is a decentralized oracle network. Q is newer with a focus on AI governance solutions, while LINK is more established with wider adoption in DeFi and smart contract ecosystems.
Q2: How do the current prices and market caps of Q and LINK compare? A: As of October 23, 2025, Q's price is $0.032215 with a 24-hour trading volume of $1,064,005. LINK's price is $17.211 with a 24-hour trading volume of $11,023,290. LINK has a significantly larger market cap and trading volume compared to Q.
Q3: What are the long-term price predictions for Q and LINK? A: By 2030, Q is predicted to reach $0.046301953086412 - $0.066211792913569 in the base scenario, with potential for higher in an optimistic scenario. LINK is predicted to reach $31.4138385656425 - $43.036958834930225 in the base scenario, with potential for higher in an optimistic scenario.
Q4: How do the supply mechanisms of Q and LINK differ? A: Q has a limited supply model with potential deflationary characteristics, while LINK has a structured distribution mechanism correlated with network growth. These mechanisms have historically driven cyclical price movements in both assets.
Q5: What are the key factors affecting the investment value of Q and LINK? A: Key factors include supply mechanisms, institutional adoption, market applications, technical development, ecosystem building, macroeconomic factors, and market cycles. Both assets are influenced by global regulatory frameworks, inflation, monetary policies, and geopolitical factors.
Q6: How should investors approach asset allocation between Q and LINK? A: Conservative investors might consider allocating 20% to Q and 80% to LINK, while aggressive investors might allocate 40% to Q and 60% to LINK. New investors may lean towards LINK for stability, while experienced investors might explore a strategic allocation to both.
Q7: What are the potential risks associated with investing in Q and LINK? A: Risks include market volatility, technical challenges (such as scalability and network security), and regulatory uncertainties. Q may face higher volatility due to its newer market positioning, while LINK's performance is closely tied to the overall health of the DeFi and smart contract markets.
Share
Content
Introduction: Investment Comparison of Q vs LINK
I. Price History Comparison and Current Market Status
Key Factors Affecting Investment Value of Q vs LINK
III. 2025-2030 Price Prediction: Q vs LINK
IV. Investment Strategy Comparison: Q vs LINK
V. Potential Risk Comparison
VI. Conclusion: Which Is the Better Buy?
FAQ

