ABT vs SHIB: Comparing Two Rising Stars in the Crypto Universe
Introduction: ABT vs SHIB Investment Comparison
In the cryptocurrency market, the comparison between ArcBlock (ABT) and Shiba Inu (SHIB) has been an unavoidable topic for investors. The two not only show significant differences in market cap ranking, application scenarios, and price performance, but also represent different positioning in crypto assets.
ArcBlock (ABT): Since its launch in 2018, it has gained market recognition for its blockchain ecosystem for building and deploying decentralized applications.
Shiba Inu (SHIB): Introduced in 2020, it has been hailed as a "meme token" and is one of the most traded and highest market cap cryptocurrencies globally.
This article will comprehensively analyze the investment value comparison between ABT and SHIB, focusing on historical price trends, supply mechanisms, institutional adoption, technological ecosystems, and future predictions, attempting to answer the question investors care about most:
"Which is the better buy right now?"
I. Price History Comparison and Current Market Status
Historical Price Trends of ABT and SHIB
- 2021: SHIB experienced a significant price surge due to increased popularity and social media hype, reaching an all-time high of $0.00008616.
- 2022: ABT saw price fluctuations in response to overall cryptocurrency market trends, with its all-time high of $4.69 recorded in May 2022.
- Comparative analysis: During the 2022 market downturn, ABT declined from its peak of $4.69 to a low of $0.04949826, while SHIB also experienced a substantial correction from its 2021 high.
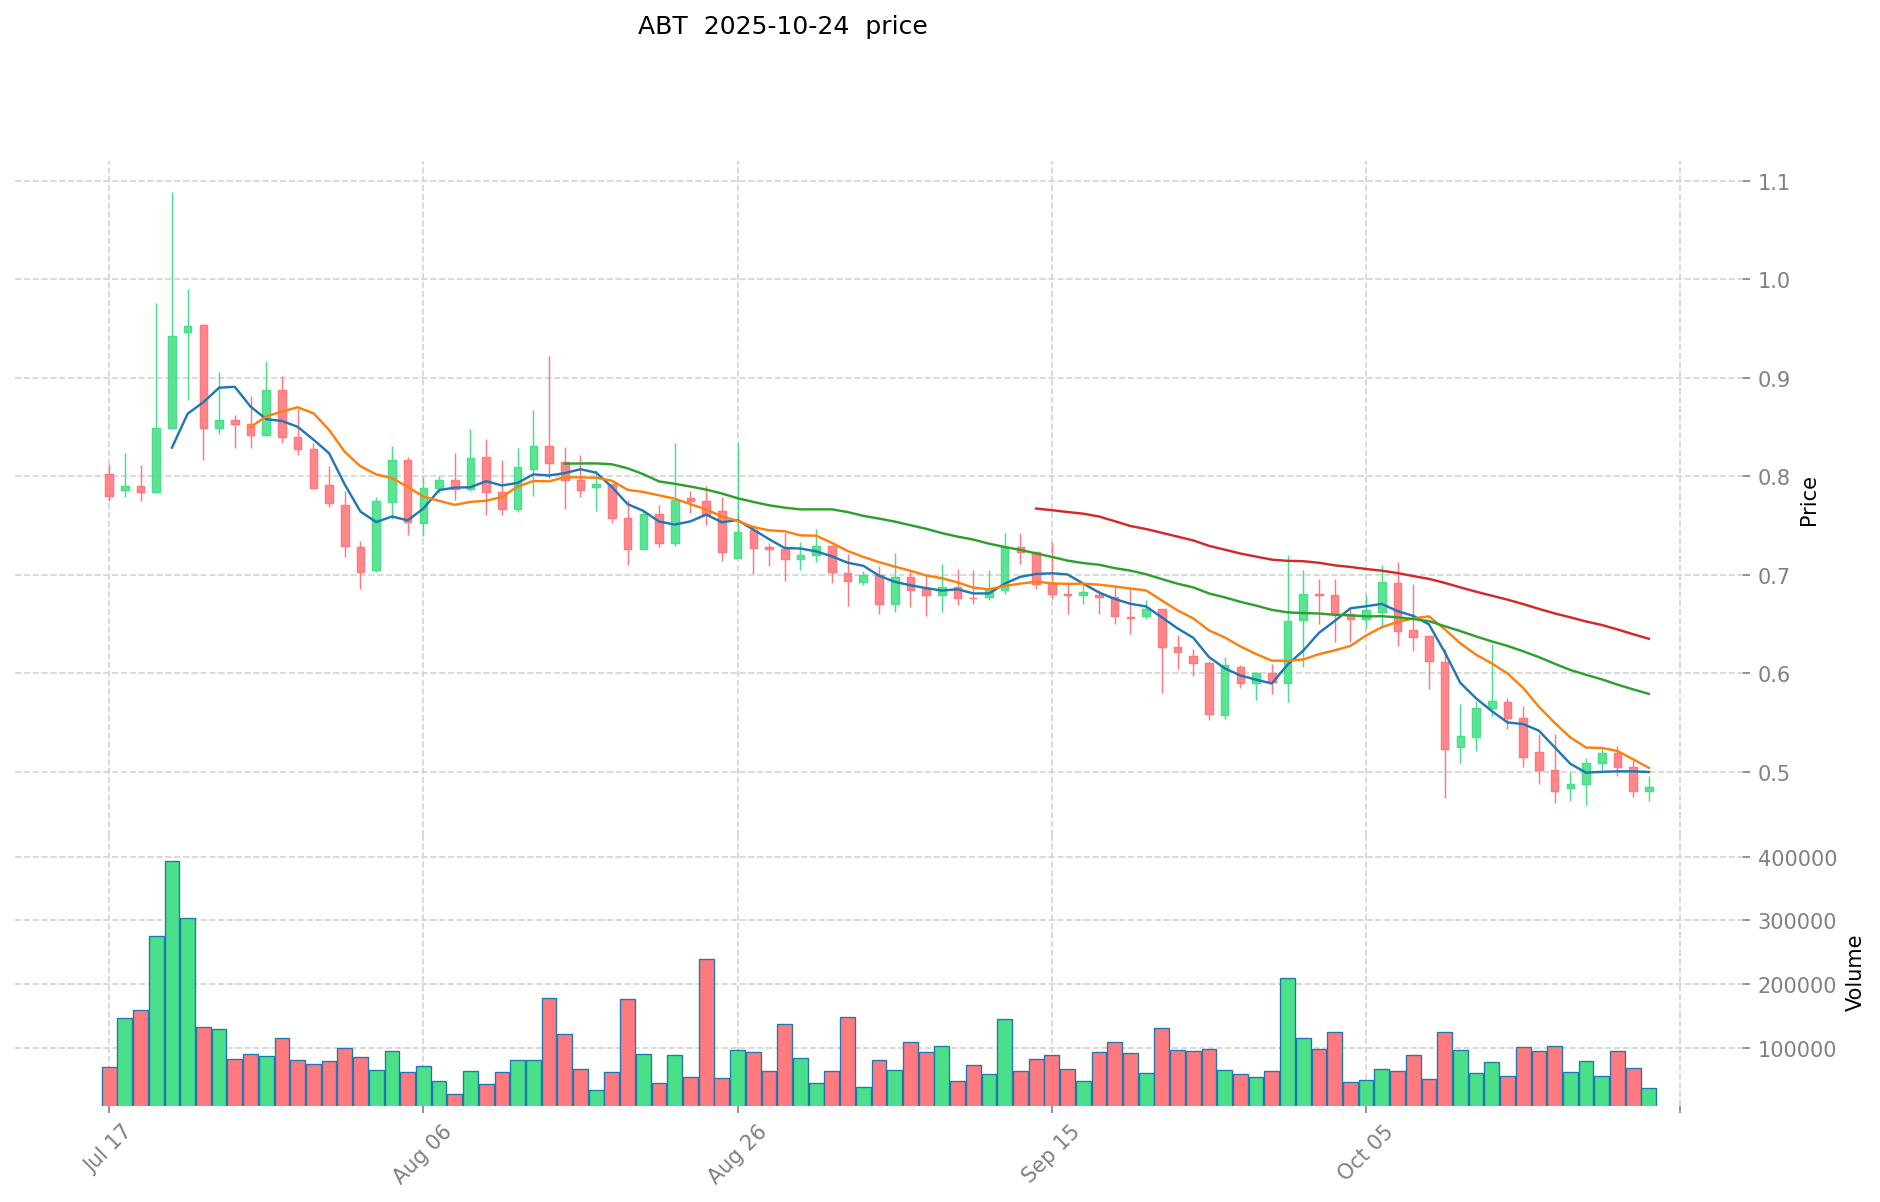
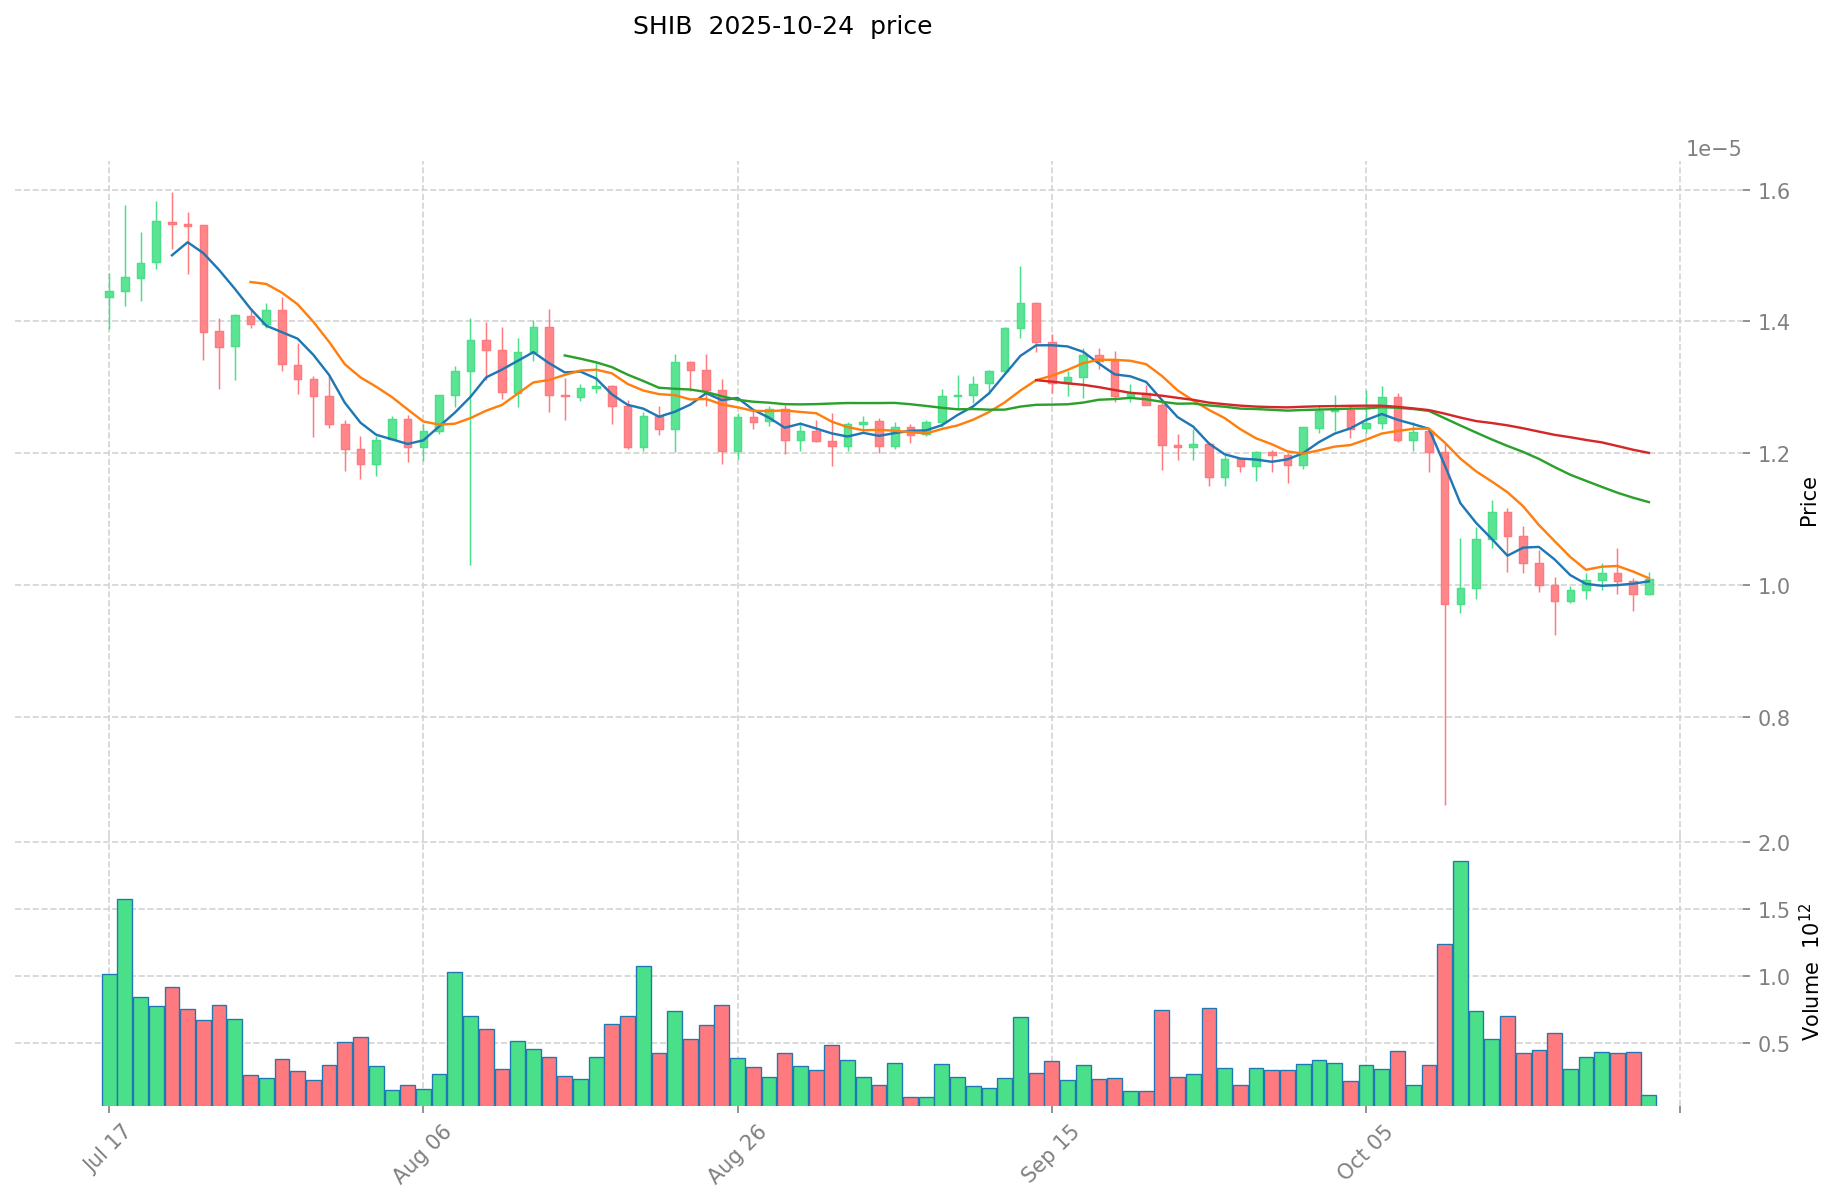
Current Market Situation (2025-10-24)
- ABT current price: $0.4845
- SHIB current price: $0.000010094
- 24-hour trading volume: ABT $18,026.02 vs SHIB $1,055,237.57
- Market Sentiment Index (Fear & Greed Index): 27 (Fear)
Click to view real-time prices:
- View ABT current price Market Price
- View SHIB current price Market Price
II. Key Factors Affecting ABT vs SHIB Investment Value
Supply Mechanism Comparison (Tokenomics)
- ABT: Blockchain foundation coin with development focused on blockchain technology trends since 2018
- SHIB: Community-driven meme token with smart algorithm features for yield optimization
- 📌 Historical pattern: Market trends and blockchain adoption cycles directly impact valuation of both assets.
Institutional Adoption and Market Applications
- Institutional Holdings: Limited information available on institutional preference between these assets
- Enterprise Applications: ABT appears to focus on AI-driven yield optimization, offering up to 12.7% increased returns over 6 months
- Regulatory Attitudes: Investors should be aware of potential regulatory risks as emphasized in investment disclosures
Technical Development and Ecosystem Building
- ABT Technical Features: Includes smart risk control systems and automated gas fee optimization
- SHIB Technical Development: Offers simplified wallet connection and wealth management features
- Ecosystem Comparison: ABT promotes easy three-step wallet integration with automatic processes
Macroeconomic and Market Cycles
- Inflation Environment Performance: Risk control and hedging strategies are important regardless of interest rate decisions
- Macroeconomic Monetary Policy: Potential interest rate cuts create market uncertainty requiring position management
- Geopolitical Factors: Blockchain technology positioned as a significant development trend similar to early internet adoption
III. 2025-2030 Price Prediction: ABT vs SHIB
Short-term Prediction (2025)
- ABT: Conservative $0.329596 - $0.4847 | Optimistic $0.4847 - $0.644651
- SHIB: Conservative $0.00000676365 - $0.000010095 | Optimistic $0.000010095 - $0.00001504155
Mid-term Prediction (2027)
- ABT may enter a growth phase, with estimated prices ranging from $0.522578941475 to $0.938123641925
- SHIB may enter a bullish market, with estimated prices ranging from $0.000013064721862 to $0.000019306755641
- Key drivers: Institutional capital inflow, ETF, ecosystem development
Long-term Prediction (2030)
- ABT: Base scenario $0.94377756830385 - $1.264661941527159 | Optimistic scenario $1.264661941527159+
- SHIB: Base scenario $0.000022752385505 - $0.000028440481881 | Optimistic scenario $0.000028440481881+
Disclaimer: This analysis is based on historical data and market projections. Cryptocurrency markets are highly volatile and unpredictable. This information should not be considered as financial advice. Always conduct your own research before making investment decisions.
ABT:
| 年份 | 预测最高价 | 预测平均价格 | 预测最低价 | 涨跌幅 |
|---|---|---|---|---|
| 2025 | 0.644651 | 0.4847 | 0.329596 | 0 |
| 2026 | 0.694550865 | 0.5646755 | 0.4517404 | 16 |
| 2027 | 0.938123641925 | 0.6296131825 | 0.522578941475 | 29 |
| 2028 | 0.9719968311435 | 0.7838684122125 | 0.4076115743505 | 61 |
| 2029 | 1.0096225149297 | 0.877932621678 | 0.51798024679002 | 81 |
| 2030 | 1.264661941527159 | 0.94377756830385 | 0.887150914205619 | 94 |
SHIB:
| 年份 | 预测最高价 | 预测平均价格 | 预测最低价 | 涨跌幅 |
|---|---|---|---|---|
| 2025 | 0.00001504155 | 0.000010095 | 0.00000676365 | 0 |
| 2026 | 0.00001646444025 | 0.000012568275 | 0.0000093005235 | 24 |
| 2027 | 0.000019306755641 | 0.000014516357625 | 0.000013064721862 | 43 |
| 2028 | 0.000021815908056 | 0.000016911556633 | 0.000012683667474 | 67 |
| 2029 | 0.000026141038665 | 0.000019363732344 | 0.000016071897846 | 91 |
| 2030 | 0.000028440481881 | 0.000022752385505 | 0.00002161476623 | 125 |
IV. Investment Strategy Comparison: ABT vs SHIB
Long-term vs Short-term Investment Strategies
- ABT: Suitable for investors focused on blockchain ecosystem development and enterprise applications
- SHIB: Suitable for investors seeking high-risk, high-reward opportunities and community-driven growth
Risk Management and Asset Allocation
- Conservative investors: ABT: 70% vs SHIB: 30%
- Aggressive investors: ABT: 40% vs SHIB: 60%
- Hedging tools: Stablecoin allocation, options, cross-currency portfolios
V. Potential Risk Comparison
Market Risk
- ABT: Volatility due to lower trading volume and market cap
- SHIB: High volatility and susceptibility to market sentiment shifts
Technical Risk
- ABT: Scalability, network stability
- SHIB: Smart contract vulnerabilities, ecosystem development challenges
Regulatory Risk
- Global regulatory policies may impact both assets differently, with meme tokens potentially facing higher scrutiny
VI. Conclusion: Which Is the Better Buy?
📌 Investment Value Summary:
- ABT advantages: Focus on blockchain technology, enterprise applications, and AI-driven yield optimization
- SHIB advantages: Strong community support, high liquidity, and potential for significant price movements
✅ Investment Advice:
- New investors: Consider a balanced approach with a higher allocation to ABT for its technological focus
- Experienced investors: Diversify between ABT and SHIB based on risk tolerance and market analysis
- Institutional investors: Focus on ABT for its enterprise applications and technological development
⚠️ Risk Warning: Cryptocurrency markets are highly volatile. This article does not constitute investment advice. None
FAQ
Q1: What are the key differences between ABT and SHIB? A: ABT is a blockchain foundation coin focused on developing decentralized applications, while SHIB is a community-driven meme token. ABT emphasizes technological development and enterprise applications, whereas SHIB relies more on community support and social media hype.
Q2: Which cryptocurrency has shown better historical price performance? A: SHIB has shown more dramatic price movements, reaching an all-time high of $0.00008616 in 2021. ABT's all-time high was $4.69 in May 2022. However, both experienced significant corrections during market downturns.
Q3: How do the supply mechanisms of ABT and SHIB differ? A: ABT focuses on blockchain technology trends since 2018, while SHIB features smart algorithms for yield optimization. The supply mechanism of SHIB is more community-driven compared to ABT's technology-oriented approach.
Q4: What are the institutional adoption patterns for ABT and SHIB? A: Limited information is available on institutional preference between these assets. However, ABT appears to focus more on enterprise applications, offering AI-driven yield optimization with up to 12.7% increased returns over 6 months.
Q5: What are the price predictions for ABT and SHIB by 2030? A: For ABT, the base scenario predicts a range of $0.94377756830385 - $1.264661941527159, with an optimistic scenario above $1.264661941527159. For SHIB, the base scenario predicts $0.000022752385505 - $0.000028440481881, with an optimistic scenario above $0.000028440481881.
Q6: How should investors allocate their portfolio between ABT and SHIB? A: Conservative investors might consider allocating 70% to ABT and 30% to SHIB, while aggressive investors might opt for 40% ABT and 60% SHIB. However, individual allocation should be based on personal risk tolerance and market analysis.
Q7: What are the main risks associated with investing in ABT and SHIB? A: Both face market risks due to cryptocurrency volatility. ABT has technical risks related to scalability and network stability, while SHIB faces risks from smart contract vulnerabilities and ecosystem development challenges. Both are subject to regulatory risks, with meme tokens potentially facing higher scrutiny.
Share
Content
Introduction: ABT vs SHIB Investment Comparison
I. Price History Comparison and Current Market Status
II. Key Factors Affecting ABT vs SHIB Investment Value
III. 2025-2030 Price Prediction: ABT vs SHIB
IV. Investment Strategy Comparison: ABT vs SHIB
V. Potential Risk Comparison
VI. Conclusion: Which Is the Better Buy?
FAQ

