2025 PHA Price Prediction: Analyzing Market Trends and Potential Growth Factors for Phala Network
Introduction: PHA's Market Position and Investment Value
Phala (PHA), as a Web3.0 privacy protection infrastructure, has made significant strides in providing privacy computing services for the Polkadot ecosystem since its inception. As of 2025, Phala's market capitalization has reached $48,374,125, with a circulating supply of approximately 815,340,051 tokens, and a price hovering around $0.05933. This asset, often referred to as the "privacy computing powerhouse," is playing an increasingly crucial role in fields such as DeFi and data services within the Polkadot ecosystem.
This article will comprehensively analyze Phala's price trends from 2025 to 2030, combining historical patterns, market supply and demand, ecosystem development, and macroeconomic factors to provide investors with professional price predictions and practical investment strategies.
I. PHA Price History Review and Current Market Status
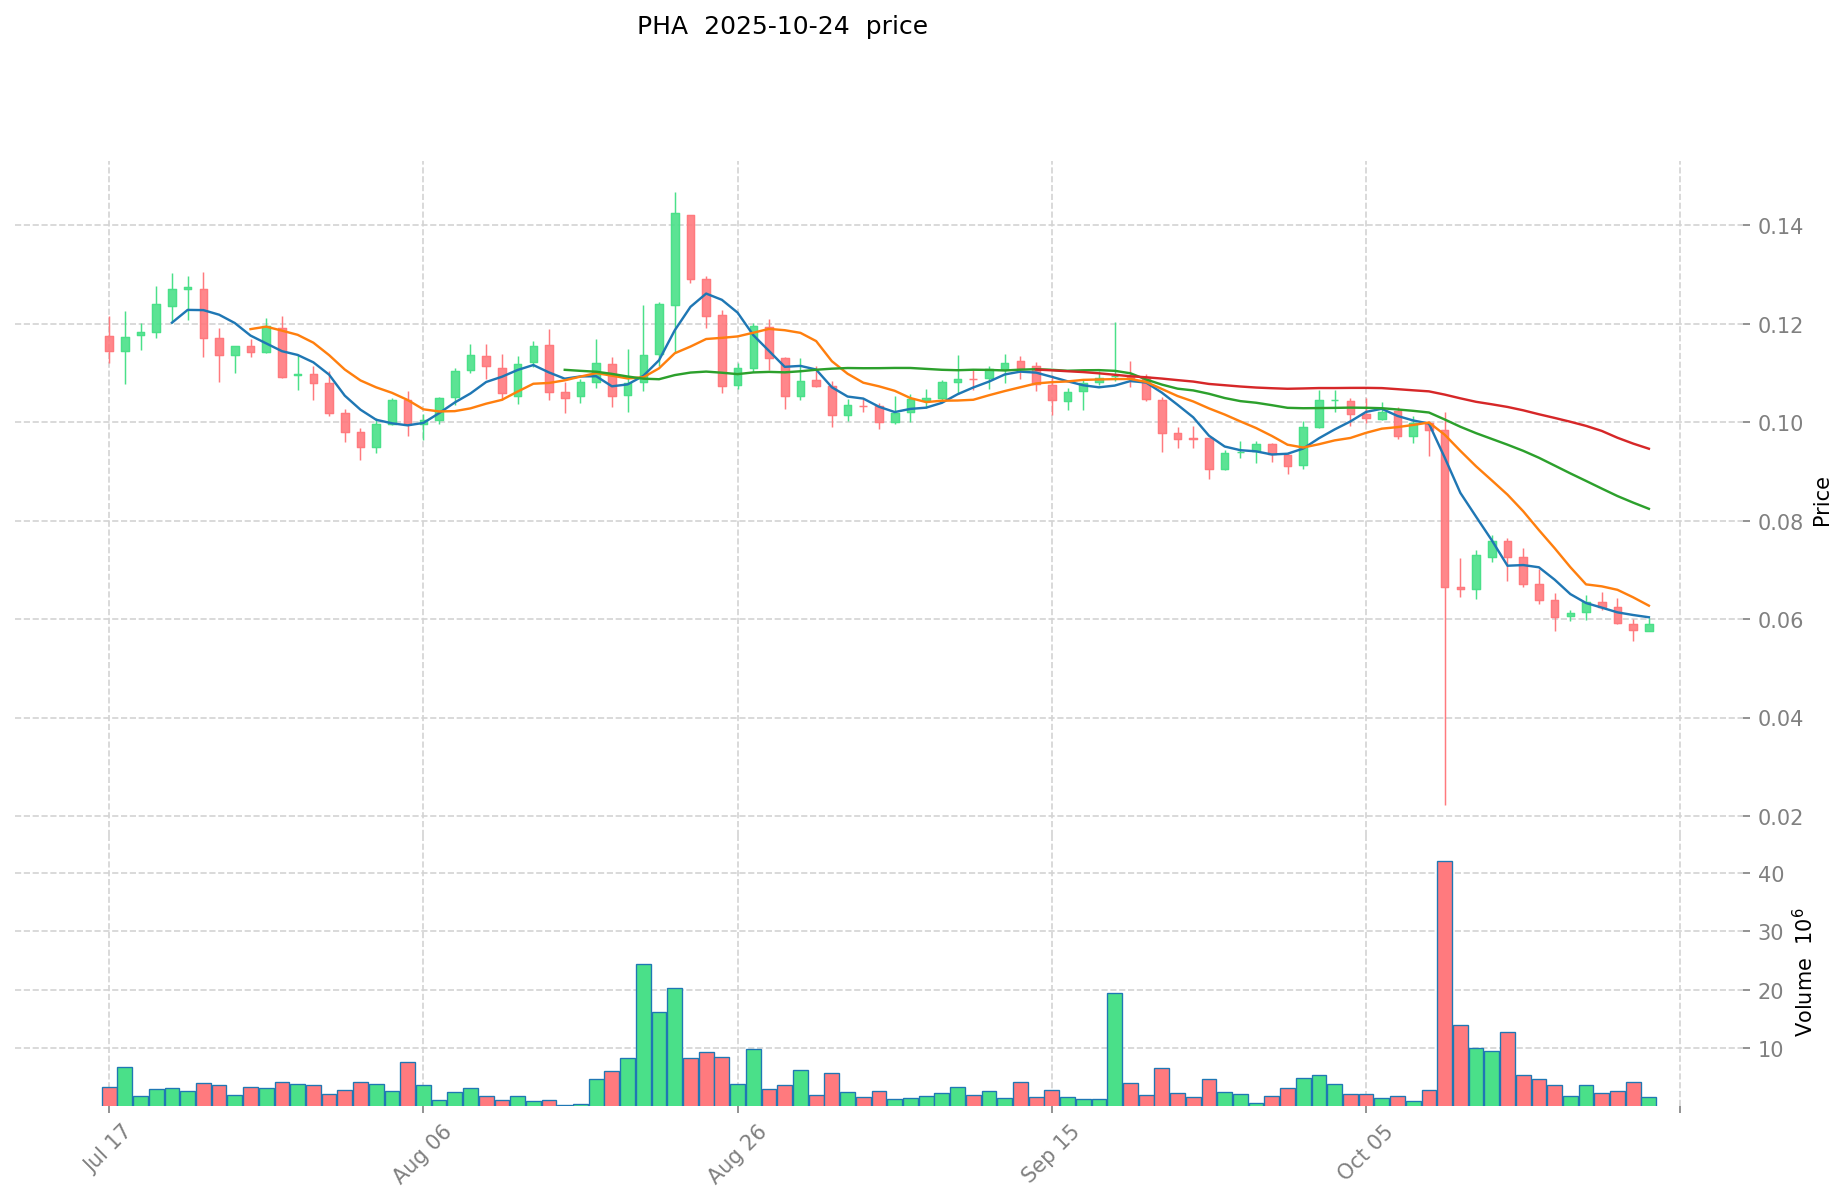
PHA Historical Price Evolution Trajectory
- 2021: All-time high reached, price peaked at $1.39 on May 15
- 2025: Market downturn, price dropped to an all-time low of $0.04017973 on October 11
PHA Current Market Situation
As of October 24, 2025, PHA is trading at $0.05933, with a market cap of $48,374,125. The token has seen a 1.92% increase in the past 24 hours, but shows a significant decline of 39.22% over the last 30 days. The current price represents a 95.73% decrease from its all-time high, indicating a prolonged bearish trend. With a circulating supply of 815,340,051 PHA tokens, representing 81.53% of the total supply, the market appears to be in a state of consolidation after recent lows. The 24-hour trading volume stands at $101,993, suggesting moderate liquidity in the current market conditions.
Click to view the current PHA market price
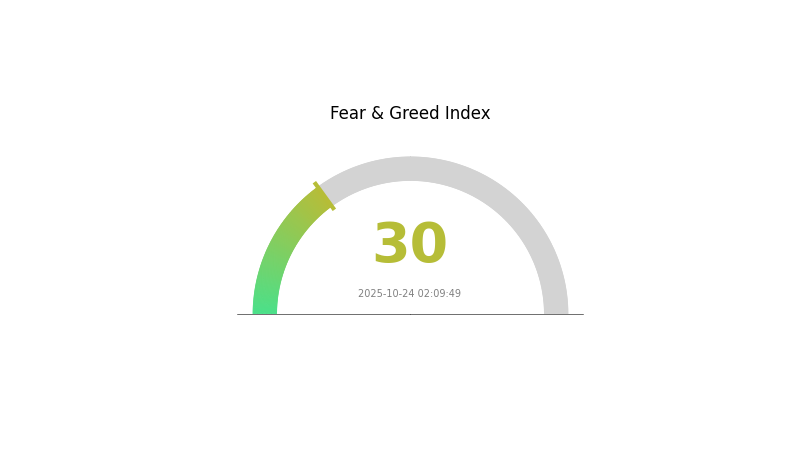
PHA Market Sentiment Indicator
2025-10-24 Fear and Greed Index: 30 (Fear)
Click to view the current Fear & Greed Index
The crypto market is currently experiencing a period of fear, with the Fear and Greed Index standing at 30. This indicates a cautious sentiment among investors, potentially signaling an opportunity for contrarian traders. While fear may dominate the market, it's essential to remember that such periods often precede market rebounds. Investors should remain vigilant, conduct thorough research, and consider dollar-cost averaging strategies. As always, diversification and risk management are crucial in navigating volatile crypto markets.
PHA Holdings Distribution
The address holdings distribution data for PHA reveals a significant concentration of tokens among a small number of addresses. The top address holds 35.02% of the total supply, while the top five addresses collectively control 68.04% of PHA tokens. This high concentration raises concerns about potential market manipulation and volatility.
Such a distribution pattern indicates a relatively centralized ownership structure, which could impact market dynamics. The dominant holders have the potential to influence price movements significantly. However, it's worth noting that 31.96% of tokens are distributed among other addresses, suggesting some level of wider distribution. This concentration pattern may affect PHA's market stability and could potentially deter some investors concerned about whale movements.
The current distribution reflects a market structure that is susceptible to large holder actions. While this doesn't necessarily imply immediate risks, it underscores the importance of monitoring large address activities for potential impacts on PHA's price and overall market behavior.
Click to view the current PHA Holdings Distribution
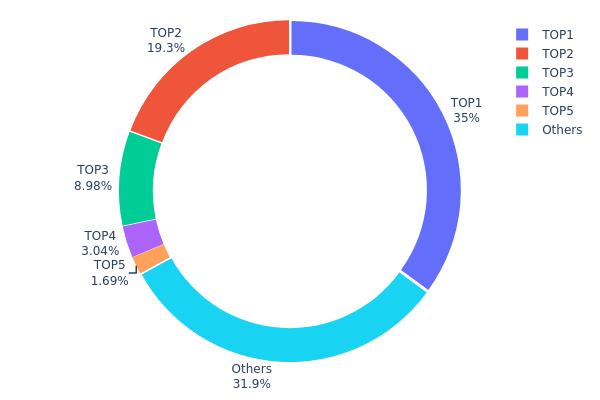
| Top | Address | Holding Qty | Holding (%) |
|---|---|---|---|
| 1 | 0xc832...c5b830 | 350221.35K | 35.02% |
| 2 | 0xf977...41acec | 193219.17K | 19.32% |
| 3 | 0x21d6...3a0ec0 | 89820.12K | 8.98% |
| 4 | 0x073f...113ad7 | 30412.11K | 3.04% |
| 5 | 0x999e...a9946e | 16887.14K | 1.68% |
| - | Others | 319440.10K | 31.96% |
II. Key Factors Affecting PHA's Future Price
Supply Mechanism
- Market Demand: The future price of PHA is closely tied to market demand, particularly in the privacy computing sector.
- Current Impact: High production costs currently limit widespread application, affecting market supply and price.
Institutional and Whale Dynamics
- Enterprise Adoption: PHA has initial industrial applications in multiple countries, indicating growing enterprise interest.
Macroeconomic Environment
- Inflation Hedging Properties: As a cryptocurrency, PHA may be viewed as a potential hedge against inflation, though its effectiveness remains to be seen.
Technical Development and Ecosystem Building
- Cost Reduction Research: Current research focuses on reducing PHA production costs, which could significantly impact future pricing.
- Ecosystem Applications: PHA is finding applications in sectors such as single-use packaging materials and disposable tableware, expanding its ecosystem.
III. PHA Price Prediction for 2025-2030
2025 Outlook
- Conservative estimate: $0.05512 - $0.05927
- Neutral estimate: $0.05927 - $0.06075
- Optimistic estimate: $0.06075 - $0.06223 (requires favorable market conditions)
2027-2028 Outlook
- Market phase expectation: Potential growth phase with increased volatility
- Price range forecast:
- 2027: $0.06394 - $0.07383
- 2028: $0.03843 - $0.09363
- Key catalysts: Project development milestones, market sentiment, and overall crypto market trends
2029-2030 Long-term Outlook
- Base scenario: $0.08175 - $0.09973 (assuming steady market growth)
- Optimistic scenario: $0.09973 - $0.11772 (assuming strong project adoption and bullish crypto market)
- Transformative scenario: $0.11772+ (exceptional project breakthroughs and mass adoption)
- 2030-12-31: PHA $0.09973 (potential year-end target based on average predictions)
| 年份 | 预测最高价 | 预测平均价格 | 预测最低价 | 涨跌幅 |
|---|---|---|---|---|
| 2025 | 0.06223 | 0.05927 | 0.05512 | 0 |
| 2026 | 0.07108 | 0.06075 | 0.03341 | 2 |
| 2027 | 0.07383 | 0.06592 | 0.06394 | 11 |
| 2028 | 0.09363 | 0.06987 | 0.03843 | 17 |
| 2029 | 0.11772 | 0.08175 | 0.04987 | 37 |
| 2030 | 0.10372 | 0.09973 | 0.06283 | 68 |
IV. PHA Professional Investment Strategies and Risk Management
PHA Investment Methodology
(1) Long-term Holding Strategy
- Suitable for: Investors seeking exposure to Web3 privacy infrastructure
- Operation suggestions:
- Accumulate PHA tokens during market dips
- Monitor Phala Network's development progress and adoption
- Store tokens in a secure hardware wallet
(2) Active Trading Strategy
- Technical analysis tools:
- Moving Averages: Use to identify trends and potential reversal points
- RSI: Monitor overbought/oversold conditions
- Key points for swing trading:
- Set clear entry and exit points based on technical indicators
- Monitor overall market sentiment and Polkadot ecosystem developments
PHA Risk Management Framework
(1) Asset Allocation Principles
- Conservative investors: 1-3% of crypto portfolio
- Aggressive investors: 5-8% of crypto portfolio
- Professional investors: 10-15% of crypto portfolio
(2) Risk Hedging Solutions
- Diversification: Spread investments across multiple privacy-focused projects
- Stop-loss orders: Implement to limit potential losses
(3) Secure Storage Solutions
- Hardware wallet recommendation: Gate Web3 Wallet
- Cold storage solution: Store long-term holdings offline
- Security precautions: Enable two-factor authentication, use strong passwords
V. Potential Risks and Challenges for PHA
PHA Market Risks
- High volatility: PHA price can experience significant fluctuations
- Limited liquidity: May face challenges in executing large trades
- Competition: Other privacy-focused projects may gain market share
PHA Regulatory Risks
- Uncertain regulatory landscape: Privacy coins may face increased scrutiny
- Compliance challenges: Potential difficulties in meeting future regulatory requirements
- Exchange delisting risk: Possibility of removal from trading platforms due to regulatory pressure
PHA Technical Risks
- Smart contract vulnerabilities: Potential for exploits in the underlying code
- Scalability challenges: May face issues as network usage increases
- Interoperability concerns: Potential difficulties in integrating with other blockchain networks
VI. Conclusion and Action Recommendations
PHA Investment Value Assessment
PHA offers exposure to the growing field of Web3 privacy infrastructure, with potential long-term value as adoption increases. However, short-term risks include high volatility and regulatory uncertainties.
PHA Investment Recommendations
✅ Beginners: Consider small, long-term positions as part of a diversified crypto portfolio ✅ Experienced investors: Implement dollar-cost averaging strategy with strict risk management ✅ Institutional investors: Conduct thorough due diligence and consider OTC trading for large positions
PHA Trading Participation Methods
- Spot trading: Available on Gate.com and other exchanges
- Staking: Participate in Phala Network's staking program for potential rewards
- DeFi integration: Explore opportunities within the Polkadot ecosystem
Cryptocurrency investments carry extremely high risks, and this article does not constitute investment advice. Investors should make decisions carefully based on their own risk tolerance and are advised to consult professional financial advisors. Never invest more than you can afford to lose.
FAQ
What is the price prediction for PHA in 2030?
Based on current trends, PHA price could reach $0.30-$0.40 by 2030, showing potential for significant growth from current levels.
Can phala coin reach $1?
Yes, Phala Network (PHA) has the potential to reach $1. Market trends and predictions suggest this milestone could be achieved by the end of 2024.
What is the future of Phala coin?
Phala coin will transition to Ethereum Layer 2, abandoning its Polkadot parachain slot. This migration follows a community-approved proposal, aiming to enhance scalability and interoperability.
Will Pepe coin reach $1 dollar?
It's unlikely Pepe coin will reach $1. Pepe Dollar (PEPD) is seen as more likely to hit this milestone in 2025.
Share
Content
Introduction: PHA's Market Position and Investment Value
I. PHA Price History Review and Current Market Status
II. Key Factors Affecting PHA's Future Price
III. PHA Price Prediction for 2025-2030
IV. PHA Professional Investment Strategies and Risk Management
V. Potential Risks and Challenges for PHA
VI. Conclusion and Action Recommendations
FAQ

