2025 ABT Price Prediction: Analyzing Market Trends and Potential Growth Factors for Arcblock Token
Introduction: ABT's Market Position and Investment Value
ArcBlock (ABT), as a blockchain ecosystem for building and deploying decentralized applications, has made significant progress since its inception in 2018. As of 2025, ArcBlock's market capitalization has reached $48,412,638, with a circulating supply of approximately 98,580,000 coins, and a price hovering around $0.4911. This asset, often referred to as a "blockchain solution integrator," is playing an increasingly crucial role in the development of decentralized applications and cloud computing integration.
This article will provide a comprehensive analysis of ArcBlock's price trends from 2025 to 2030, combining historical patterns, market supply and demand, ecosystem development, and macroeconomic factors to offer professional price predictions and practical investment strategies for investors.
I. ABT Price History Review and Current Market Status
ABT Historical Price Evolution Trajectory
- 2020: Reached all-time low of $0.04949826 on March 13, amid global market turmoil
- 2024: Hit all-time high of $4.69 on May 22, marking a significant bull run
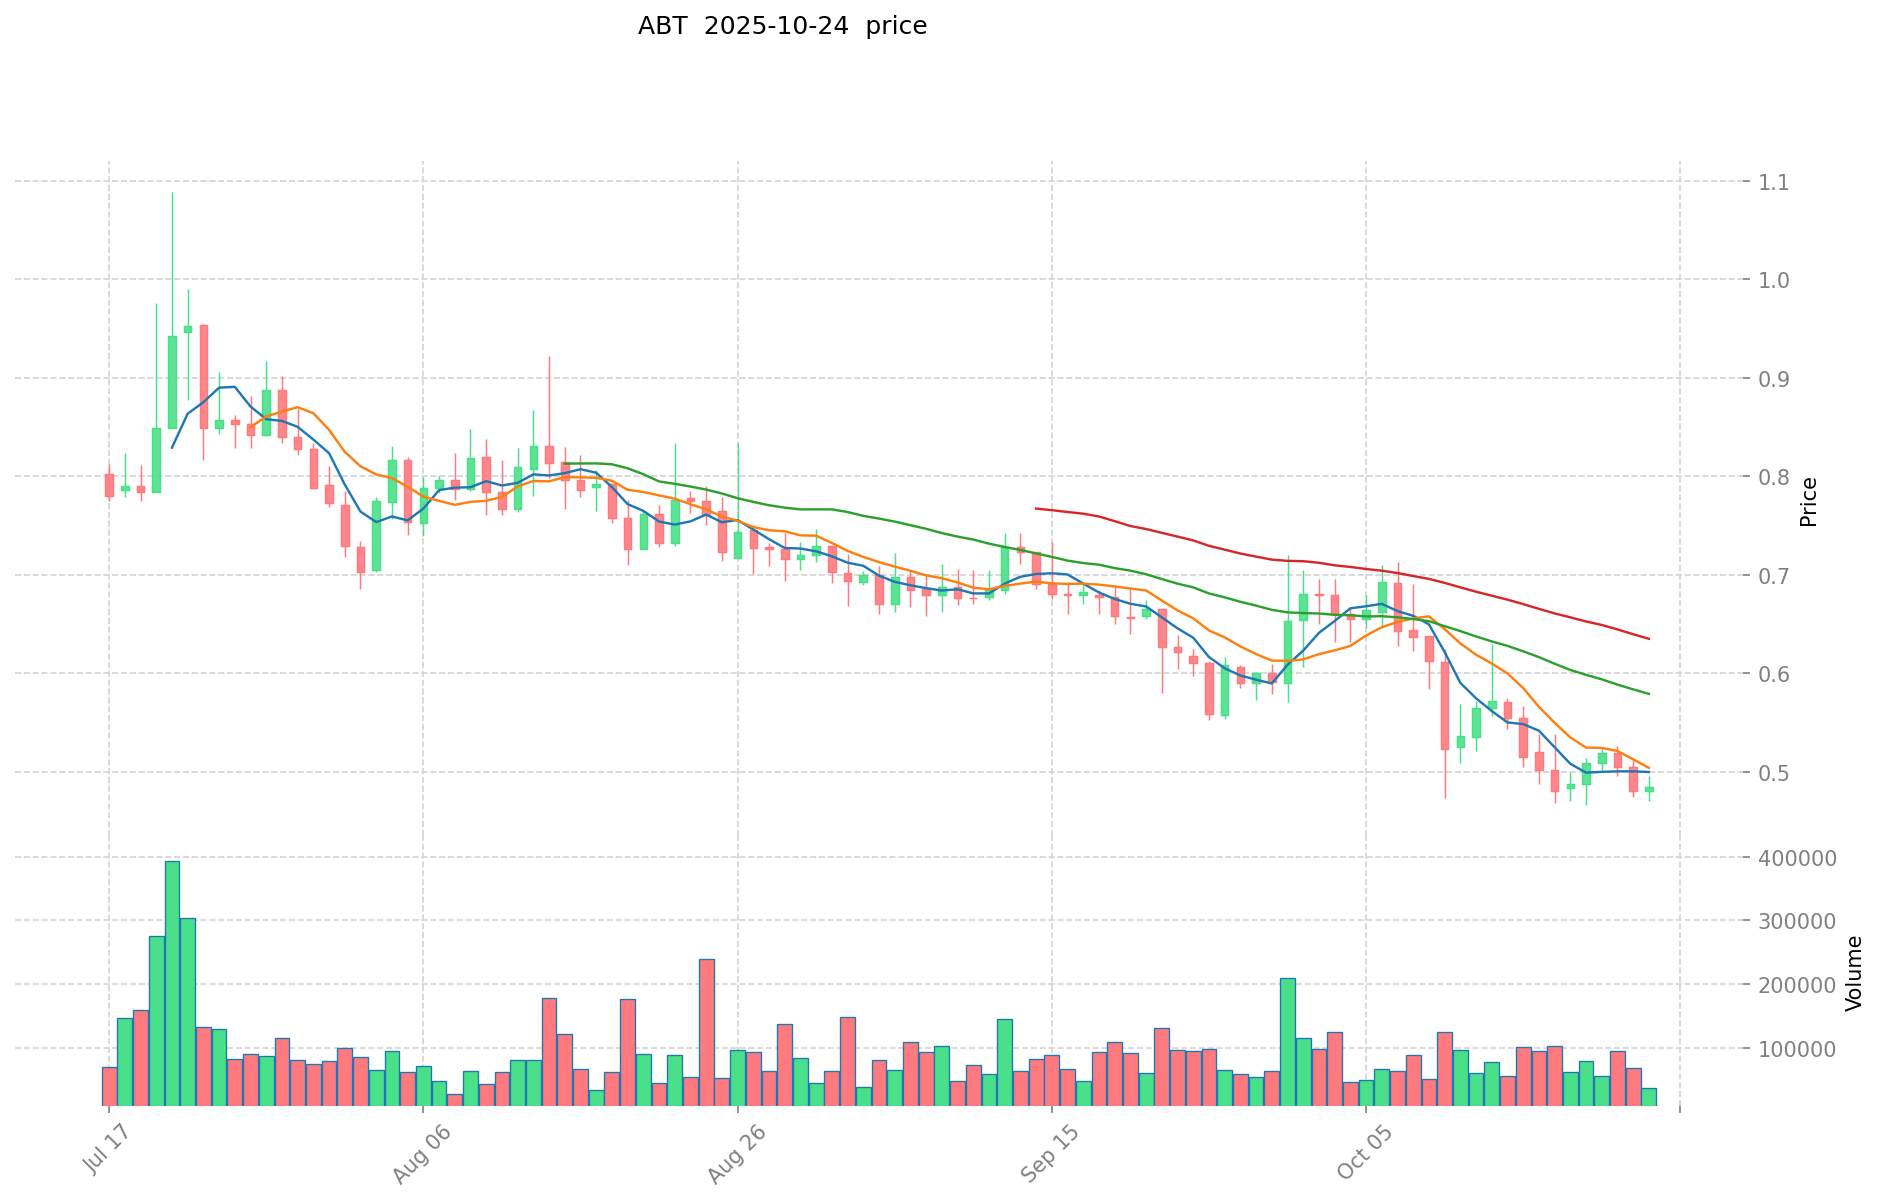
- 2025: Experienced a substantial correction, price declined by over 70% year-on-year
ABT Current Market Situation
As of October 24, 2025, ABT is trading at $0.4911, with a 24-hour trading volume of $18,183.94. The token has shown a slight recovery in the short term, with a 1.38% increase over the past 24 hours and a 0.97% gain in the last hour. However, the medium to long-term trend remains bearish, as evidenced by the -5.48% change over the past week and a significant -20.96% decline over the last 30 days.
ABT's market capitalization currently stands at $48,412,638, ranking it 629th in the cryptocurrency market. The circulating supply is 98,580,000 ABT, which represents 53% of the total supply of 186,000,000 tokens. The fully diluted market cap is $91,344,600.
Despite the recent positive short-term momentum, ABT is still trading at about 89.53% below its all-time high, indicating a challenging market environment for the token.
Click to view the current ABT market price
ABT Market Sentiment Indicator
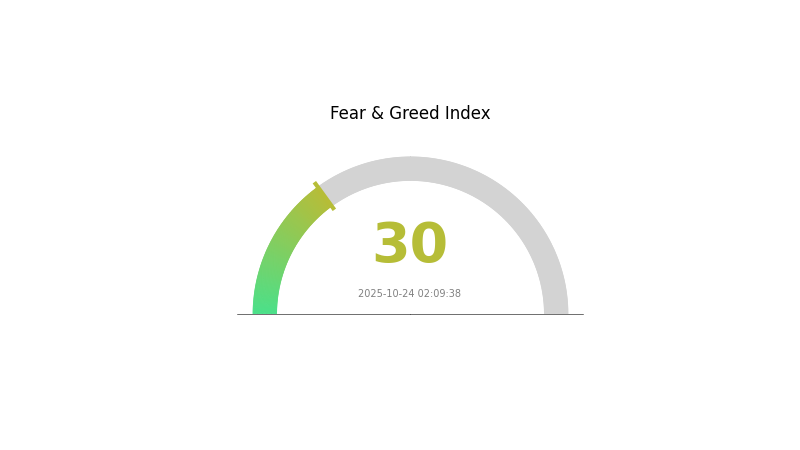
2025-10-24 Fear and Greed Index: 30 (Fear)
Click to view the current Fear & Greed Index
The crypto market is currently gripped by fear, with the Fear and Greed Index standing at 30. This indicates a cautious sentiment among investors, potentially presenting buying opportunities for those with a higher risk tolerance. However, it's crucial to conduct thorough research and exercise caution before making any investment decisions. Remember, market sentiments can shift rapidly, and it's essential to stay informed about the latest developments in the crypto space.
ABT Holdings Distribution
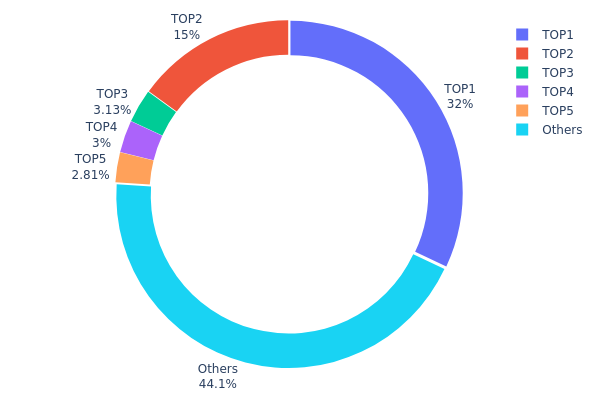
The address holdings distribution data provides insight into the concentration of ABT tokens among different addresses. Analysis of this data reveals a significant concentration of ABT tokens in a few top addresses. The top address holds 32% of the total supply, while the second-largest holder possesses 15%. Together, the top five addresses control 55.94% of all ABT tokens.
This high concentration of tokens in a small number of addresses raises concerns about centralization and potential market manipulation. With over half of the supply controlled by just five addresses, there is a risk of large sell-offs or coordinated actions that could significantly impact ABT's price and market stability. The remaining 44.06% distributed among other addresses suggests a moderate level of decentralization, but the overall structure indicates a top-heavy distribution.
Such a concentrated holding pattern may lead to increased volatility and susceptibility to whale movements. It also highlights the importance of monitoring these large addresses for any significant changes in their holdings, as their actions could serve as leading indicators for potential market shifts in ABT's ecosystem.
Click to view the current ABT Holdings Distribution
| Top | Address | Holding Qty | Holding (%) |
|---|---|---|---|
| 1 | 0x58f2...017484 | 59520.00K | 32.00% |
| 2 | 0xa63f...ae5508 | 27900.00K | 15.00% |
| 3 | 0xc205...3fc6f5 | 5825.21K | 3.13% |
| 4 | 0x3586...f10d20 | 5584.28K | 3.00% |
| 5 | 0xc635...af0b40 | 5231.63K | 2.81% |
| - | Others | 81938.88K | 44.06% |
II. Key Factors Influencing ABT's Future Price
Institutional and Major Holder Dynamics
- Corporate Adoption: Abbott Laboratories maintains a leading position in the global healthcare sector, particularly in medical devices.
Macroeconomic Environment
- Monetary Policy Impact: Interest rate changes affect ABT's stock price. Lower interest rates generally benefit growth stocks by reducing financing costs and increasing valuation multiples.
- Inflation Hedging Properties: As a healthcare company, Abbott may offer some defensive characteristics during inflationary periods.
- Geopolitical Factors: International market trends and geopolitical events can impact ABT's global sales and operations.
Technological Development and Ecosystem Building
- Medical Device Innovation: Strong growth in the medical device division, particularly in cardiology and diabetes management products, drives ABT's performance.
- Diagnostic Technology: Changes in diagnostic product demand, such as COVID-19 testing, affect ABT's revenue streams.
- Ecosystem Applications: Abbott's diverse portfolio across medical devices, diagnostics, and nutrition supports its ecosystem in the healthcare industry.
III. ABT Price Prediction for 2025-2030
2025 Outlook
- Conservative prediction: $0.39272 - $0.4909
- Neutral prediction: $0.4909 - $0.52772
- Optimistic prediction: $0.52772 - $0.56454 (requires favorable market conditions and increased adoption)
2027-2028 Outlook
- Market phase expectation: Potential growth phase with increasing adoption
- Price range forecast:
- 2027: $0.49648 - $0.73289
- 2028: $0.58253 - $0.88042
- Key catalysts: Technological advancements, wider market acceptance, and potential partnerships
2029-2030 Long-term Outlook
- Base scenario: $0.77119 - $0.88302 (assuming steady market growth and adoption)
- Optimistic scenario: $0.88302 - $1.1126 (assuming strong market performance and increased utility)
- Transformative scenario: $1.1126 - $1.25 (assuming breakthrough innovations and mass adoption)
- 2030-12-31: ABT $0.88302 (potential stabilization point after significant growth)
| 年份 | 预测最高价 | 预测平均价格 | 预测最低价 | 涨跌幅 |
|---|---|---|---|---|
| 2025 | 0.56454 | 0.4909 | 0.39272 | 0 |
| 2026 | 0.65437 | 0.52772 | 0.31135 | 7 |
| 2027 | 0.73289 | 0.59104 | 0.49648 | 20 |
| 2028 | 0.88042 | 0.66197 | 0.58253 | 34 |
| 2029 | 0.99484 | 0.77119 | 0.74035 | 57 |
| 2030 | 1.1126 | 0.88302 | 0.68875 | 79 |
IV. ABT Professional Investment Strategies and Risk Management
ABT Investment Methodology
(1) Long-term Holding Strategy
- Suitable for: Long-term investors with high risk tolerance
- Operation suggestions:
- Accumulate ABT during market dips
- Set price targets and rebalance portfolio periodically
- Store ABT in secure hardware wallets
(2) Active Trading Strategy
- Technical analysis tools:
- Moving Averages: Identify trend direction and potential reversal points
- RSI (Relative Strength Index): Spot overbought and oversold conditions
- Key points for swing trading:
- Monitor ABT's correlation with major cryptocurrencies
- Set strict stop-loss orders to manage downside risk
ABT Risk Management Framework
(1) Asset Allocation Principles
- Conservative investors: 1-3% of crypto portfolio
- Aggressive investors: 5-10% of crypto portfolio
- Professional investors: Up to 15% of crypto portfolio
(2) Risk Hedging Solutions
- Diversification: Spread investments across multiple cryptocurrencies
- Options trading: Use put options to protect against downside risk
(3) Secure Storage Solutions
- Hot wallet recommendation: Gate Web3 wallet
- Cold storage solution: Use hardware wallets for long-term holdings
- Security precautions: Enable two-factor authentication, use unique passwords
V. Potential Risks and Challenges for ABT
ABT Market Risks
- High volatility: ABT price can experience significant fluctuations
- Limited liquidity: May face challenges in executing large trades
- Market sentiment: Susceptible to broader crypto market trends
ABT Regulatory Risks
- Uncertain regulatory landscape: Potential for new regulations affecting ABT
- Cross-border restrictions: Varying legal status in different jurisdictions
- Compliance requirements: Changing KYC/AML standards may impact accessibility
ABT Technical Risks
- Smart contract vulnerabilities: Potential for code exploits
- Scalability challenges: May face issues with network congestion
- Interoperability concerns: Compatibility with other blockchain networks
VI. Conclusion and Action Recommendations
ABT Investment Value Assessment
ABT offers potential in the blockchain ecosystem but faces significant market, regulatory, and technical risks. Long-term value proposition remains speculative, while short-term volatility presents both opportunities and challenges.
ABT Investment Recommendations
✅ Beginners: Start with small positions, focus on education ✅ Experienced investors: Consider ABT as part of a diversified crypto portfolio ✅ Institutional investors: Conduct thorough due diligence, monitor regulatory developments
ABT Trading Participation Methods
- Spot trading: Buy and sell ABT on Gate.com
- Staking: Participate in staking programs if available
- DeFi integration: Explore decentralized finance options using ABT
Cryptocurrency investments carry extremely high risks, and this article does not constitute investment advice. Investors should make decisions cautiously based on their own risk tolerance and are advised to consult professional financial advisors. Never invest more than you can afford to lose.
FAQ
Is ABT a buy, sell, or hold?
Based on current market analysis, ABT is considered a buy. Most experts recommend purchasing ABT, with a majority view leaning towards a strong buy position.
What is the stock price forecast for ABT in 2025?
Based on current projections, the average stock price forecast for ABT in 2025 is $120.48, with a high estimate of $147.28 and a low estimate of $93.69.
Does the bat token have a future?
Yes, BAT token has a promising future. With the development of Pay With BAT, users will be able to pay for content and services using BAT, enhancing its utility and potential for growth.
Will bitcoin reach $150,000 in 2025?
Yes, Bitcoin reached $150,000 in 2025. This milestone was achieved due to increased institutional adoption and favorable regulatory environment.
Share
Content
Introduction: ABT's Market Position and Investment Value
I. ABT Price History Review and Current Market Status
II. Key Factors Influencing ABT's Future Price
III. ABT Price Prediction for 2025-2030
IV. ABT Professional Investment Strategies and Risk Management
V. Potential Risks and Challenges for ABT
VI. Conclusion and Action Recommendations
FAQ

