Trade
Trading Type
Spot
Trade crypto freely
Alpha
Points
Get promising tokens in streamlined on-chain trading
Pre-Market
Trade new tokens before they are officially listed
Margin
Magnify your profit with leverage
Convert & Block Trading
0 Fees
Trade any size with no fees and no slippage
Leveraged Tokens
Get exposure to leveraged positions simply
Futures
Futures
Points
Hundreds of contracts settled in USDT or BTC
Options
HOT
Trade European-style vanilla options
Unified Account
Maximize your capital efficiency
Demo Trading
Futures Kickoff
Get prepared for your futures trading
Futures Events
Participate in events to win generous rewards
Demo Trading
Use virtual funds to experience risk-free trading
Earn
Launch
CandyDrop
Collect candies to earn airdrops
Launchpool
Quick staking, earn potential new tokens
HODLer Airdrop
Hold GT and get massive airdrops for free
Launchpad
Be early to the next big token project
Alpha Points
New
Trade on-chain assets and enjoy airdrop rewards!
Futures Points
New
Earn futures points and claim airdrop rewards
Investment
Simple Earn
Earn interests with idle tokens
Auto-Invest
Auto-invest on a regular basis
Dual Investment
Buy low and sell high to take profits from price fluctuations
Soft Staking
Earn rewards with flexible staking
Crypto Loan
0 Fees
Pledge one crypto to borrow another
Lending Center
One-Stop Lending Hub
VIP Wealth Hub
New
Customized wealth management empowers your assets growth
Private Wealth Management
Customized asset management to grow your digital assets
Quant Fund
Top asset management team helps you profit without hassle
Staking
Stake cryptos to earn in PoS products
BTC Staking
HOT
Stake BTC and earn 10% APR
GUSD Minting
New
Use USDT/USDC to mint GUSD for treasury-level yields
More


- Trending TopicsView More
1K Popularity
14.5K Popularity
57.2K Popularity
8.1K Popularity
715 Popularity
- Hot Gate FunView More
- MC:$851.3KHolders:5283
- MC:$465.6KHolders:10608
- MC:$611.2KHolders:137
- MC:$454.1KHolders:22771
- MC:$74KHolders:20401
- Pin
- 🚀 #GateNewbieVillageEpisode4 ✖️ @比特一哥
📈 Follow the trend, pick your points, wait for the signal
💬 Share your trading journey | Discuss strategies | Grow with the Gate Family
⏰ Event Date: Oct 25 04:00 – Nov 2 16:00 UTC
How to Join:
1️⃣ Follow Gate_Square + @比特一哥
2️⃣ Post on Gate Square with the hashtag #GateNewbieVillageEpisode4
3️⃣ Share your trading growth, insights, or experience
— The more genuine and insightful your post, the higher your chance to win!
🎁 Rewards
3 lucky participants → Gate X RedBull Cap + $20 Position Voucher
If delivery is unavailable, replaced with a $30 Position V - 💥 Gate Square Event: #PostToWinCGN 💥
Post original content on Gate Square related to CGN, Launchpool, or CandyDrop, and get a chance to share 1,333 CGN rewards!
📅 Event Period: Oct 24, 2025, 10:00 – Nov 4, 2025, 16:00 UTC
📌 Related Campaigns:
Launchpool 👉 https://www.gate.com/announcements/article/47771
CandyDrop 👉 https://www.gate.com/announcements/article/47763
📌 How to Participate:
1️⃣ Post original content related to CGN or one of the above campaigns (Launchpool / CandyDrop).
2️⃣ Content must be at least 80 words.
3️⃣ Add the hashtag #PostToWinCGN
4️⃣ Include a screenshot s - Are you a true GT Holder? 😎
Take a look — which one is the real GT? 💎
💰 Join the fun! 5 lucky users will each win a $10 Position Voucher!
👉 How to participate:
1️⃣ Follow Gate_Square
2️⃣ Like this post
3️⃣ Comment with your answer
🗓️ Deadline: October 31, 2025, 24:00 (UTC+8) - 🎒 Gate Square “Blue & White Travel Season” Merch Challenge is here!
📸 Theme: #GateAnywhere🌍
Let’s bring Gate’s blue and white to every corner of the world.
— Open the gate, Gate Anywhere
Take your Gate merch on the go — show us where blue and white meet your life!
At the office, on the road, during a trip, or in your daily setup —
wherever you are, let Gate be part of the view 💙
💡 Creative Ideas (Any style, any format!)
Gate merch displays
Blue & white outfits
Creative logo photography
Event or travel moments
The more personal and creative your story, the more it shines ✨
✅ How to Partici
Bitcoin Surpasses 50-Day Average, but CoinDesk BTC Trend Indicator Remains Bearish
Bitcoin BTC$115,222.04 has recently crossed above the 50-day simple moving average (SMA), a widely observed indicator of a short-term bullish trend. This breakout is validated by technical indicators including a fresh bullish crossover on the daily MACD histogram and a bullish cross between the 5- and 10-day SMAs, signaling growing upward momentum.
The recent upswing in BTC price is likely fueled by market expectations of a Federal Reserve rate cut anticipated this Wednesday and positive developments in the ongoing U.S.-China trade tensions.
Despite these encouraging signs, caution is warranted as the Bitcoin Trend Indicator (BTI), which gauges the presence, direction, and strength of momentum, continues to signal downtrend. Further, BTC prices remain below the Ichimoku cloud on the daily chart, a key resistance level. A decisive move above this cloud would confirm the bullish revival and potentially set the stage for a rally toward $120,000 and beyond.
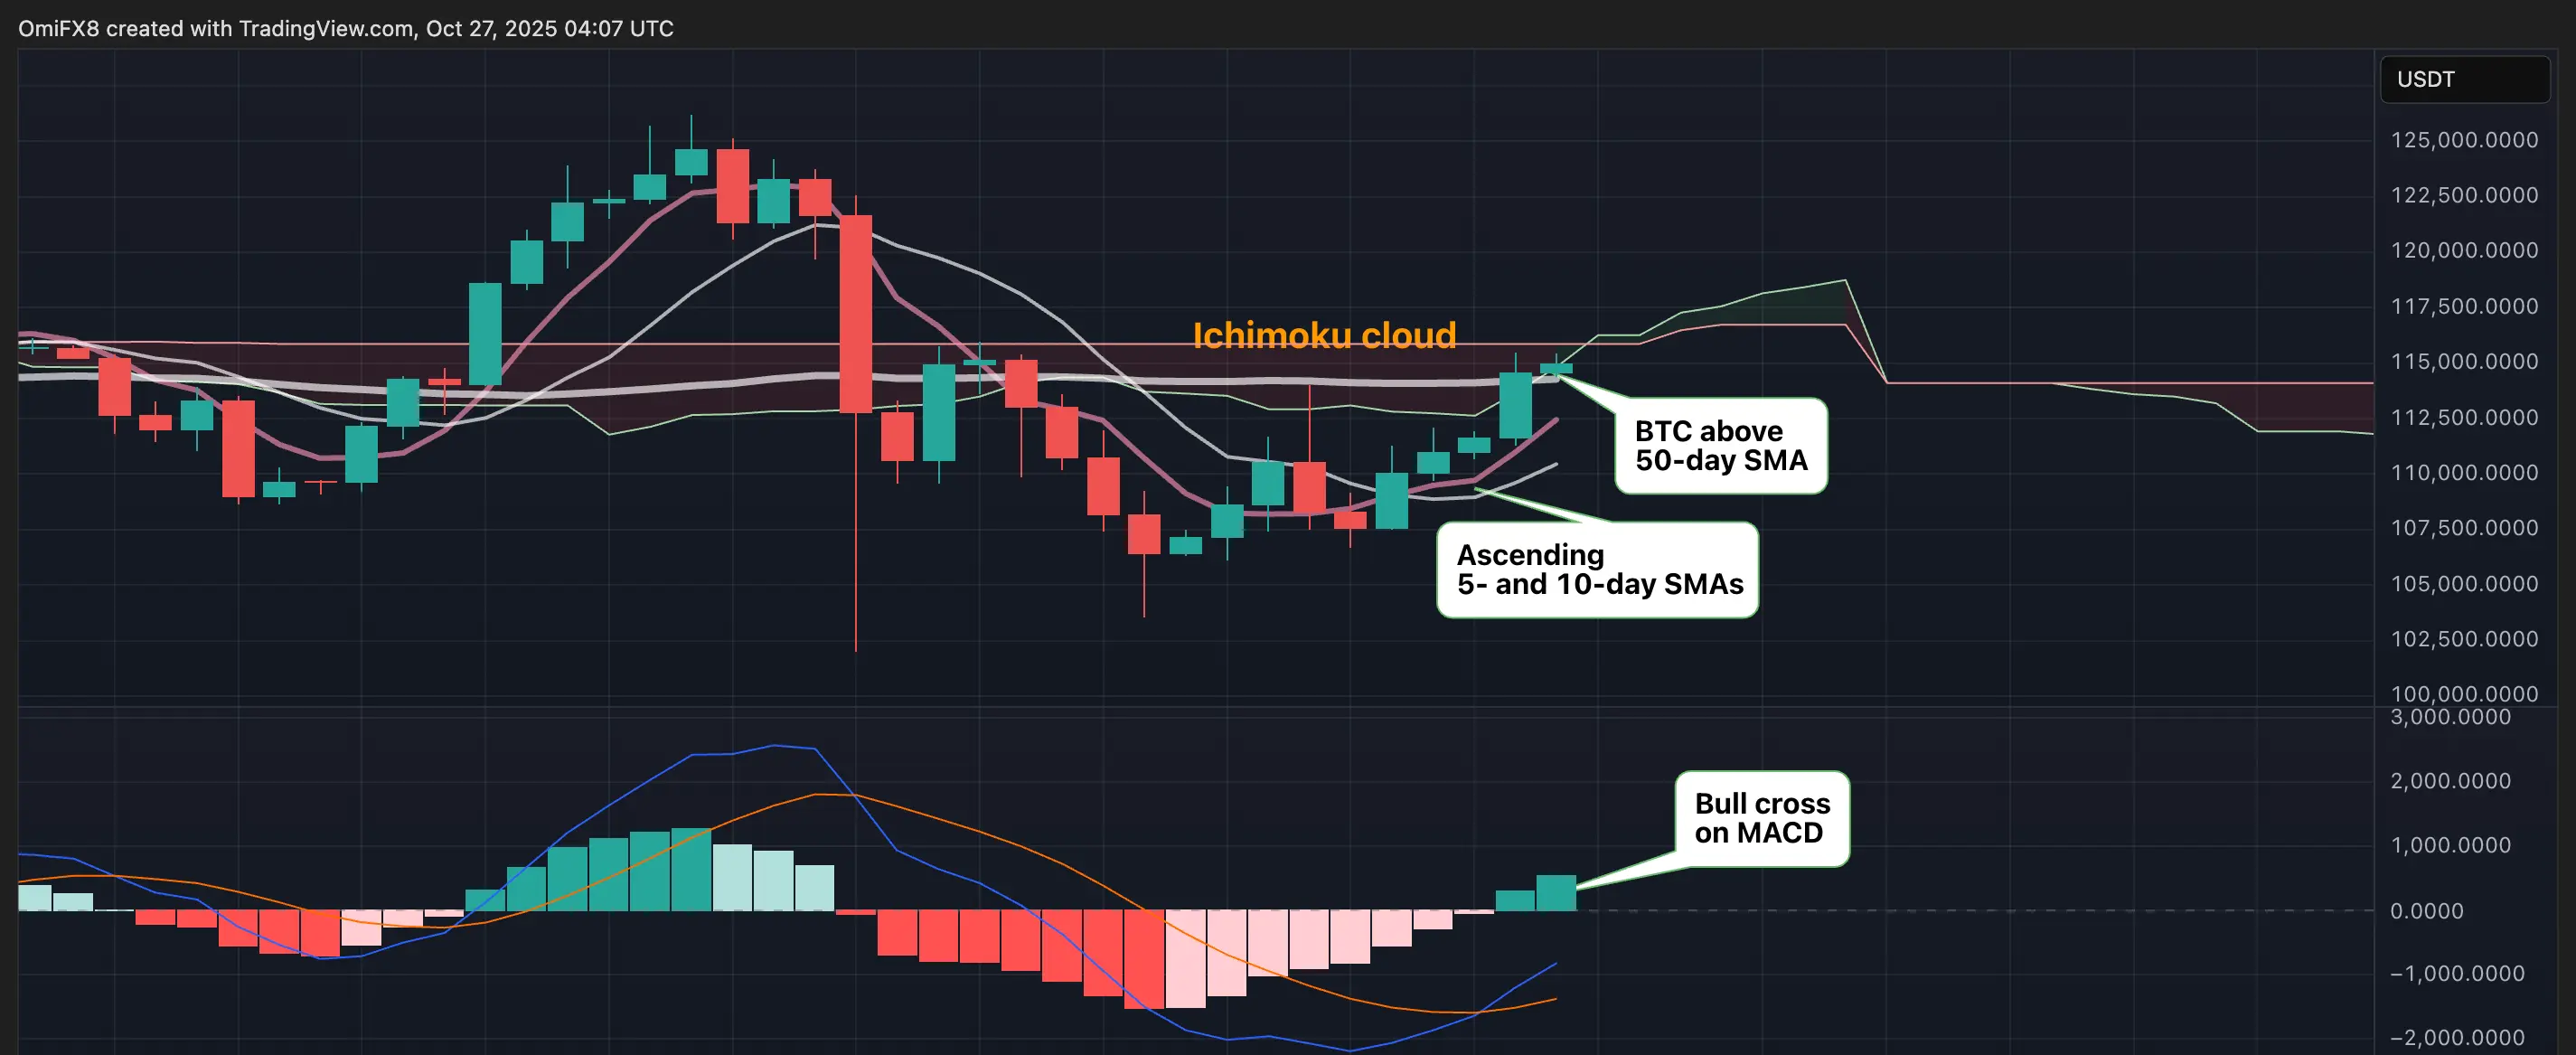
BTC’s daily chart.