ETH Drops Below $4,000 Again: Is the “Accumulation Phase” Underway?
Market Overview: ETH Once Again Falls Below a Key Price Level
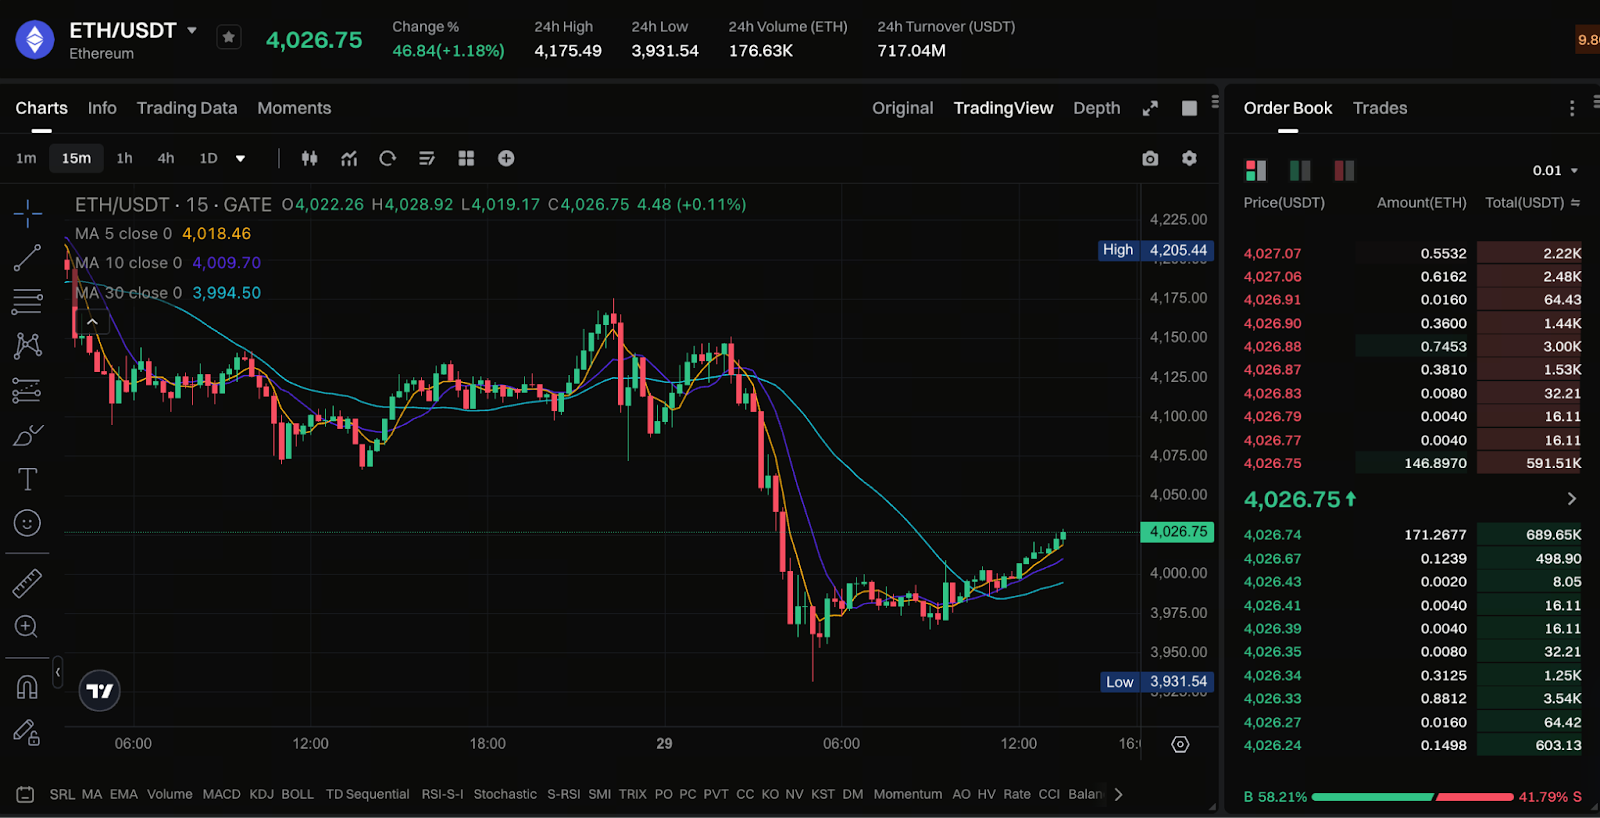
Chart: https://www.gate.com/trade/ETH_USDT
The crypto market saw renewed volatility at the end of October. Data shows ETH/USDT hit an intraday high of $4,175 before quickly dropping to the $3,930 range. This swing of over 5% took many short-term traders by surprise.
Technical Analysis: Support and Resistance Dynamics
From a market structure perspective, ETH has established a crucial psychological threshold at $4,000. This level is both a technical dividing line for bulls and bears and a reflection of investor confidence. When ETH broke below $4,000, stop-loss selling increased, intensifying volatility.
Technically, ETH’s short-term moving averages (MA5 and MA10) have crossed downward, signaling the short-term correction trend remains in play. The MA30, however, is still flat, indicating the broader mid-term trend is stable. If ETH can hold support in the $3,950–$3,980 zone, the market may be set for another rebound.
On-Chain Data: Institutional and Whale Movements
On-chain data reveals that whale addresses increased their holdings during the price dip. Glassnode’s latest data shows a slight uptick in addresses holding over 1,000 ETH, suggesting institutions are using the price decline to accumulate positions.
Investor Sentiment: Short-Term Anxiety and Long-Term Confidence
At the same time, the market’s Fear and Greed Index has dropped to 52, indicating sentiment has cooled from overheated to neutral. This often signals that short-term risks have been released, setting the stage for the next market move.
Conclusion
ETH’s latest dip below $4,000 isn’t necessarily negative. In fact, this short-term adjustment helps flush out speculative positions and reinforce the bottom structure. If Ethereum stays above $3,900 and on-chain activity picks up, the market could regain upward momentum heading into year-end.
Share
Content


Related Articles

Pi Coin Transaction Guide: How to Transfer to Gate.io

Flare Crypto Explained: What Is Flare Network and Why It Matters in 2025

What is N2: An AI-Driven Layer 2 Solution

How to Use a Crypto Whale Tracker: Top Tool Recommendation for 2025 to Follow Whale Moves

Understand Baby doge coin in one article
