2025 Q Price Prediction: Navigating the Future of Quantum Computing Costs
Introduction: Q's Market Position and Investment Value
Quack AI (Q), positioned as the AI-native governance layer for Web3, has made significant strides since its inception. As of 2025, Quack AI's market capitalization has reached $51,826,736, with a circulating supply of approximately 1,616,000,000 tokens, and a price hovering around $0.032071. This asset, hailed as the "AI-powered governance solution," is playing an increasingly crucial role in decentralized decision-making and automation for DAOs and RWA projects.
This article will comprehensively analyze Quack AI's price trends from 2025 to 2030, combining historical patterns, market supply and demand, ecosystem development, and macroeconomic factors to provide investors with professional price predictions and practical investment strategies.
I. Q Price History Review and Current Market Status
Q Historical Price Evolution Trajectory
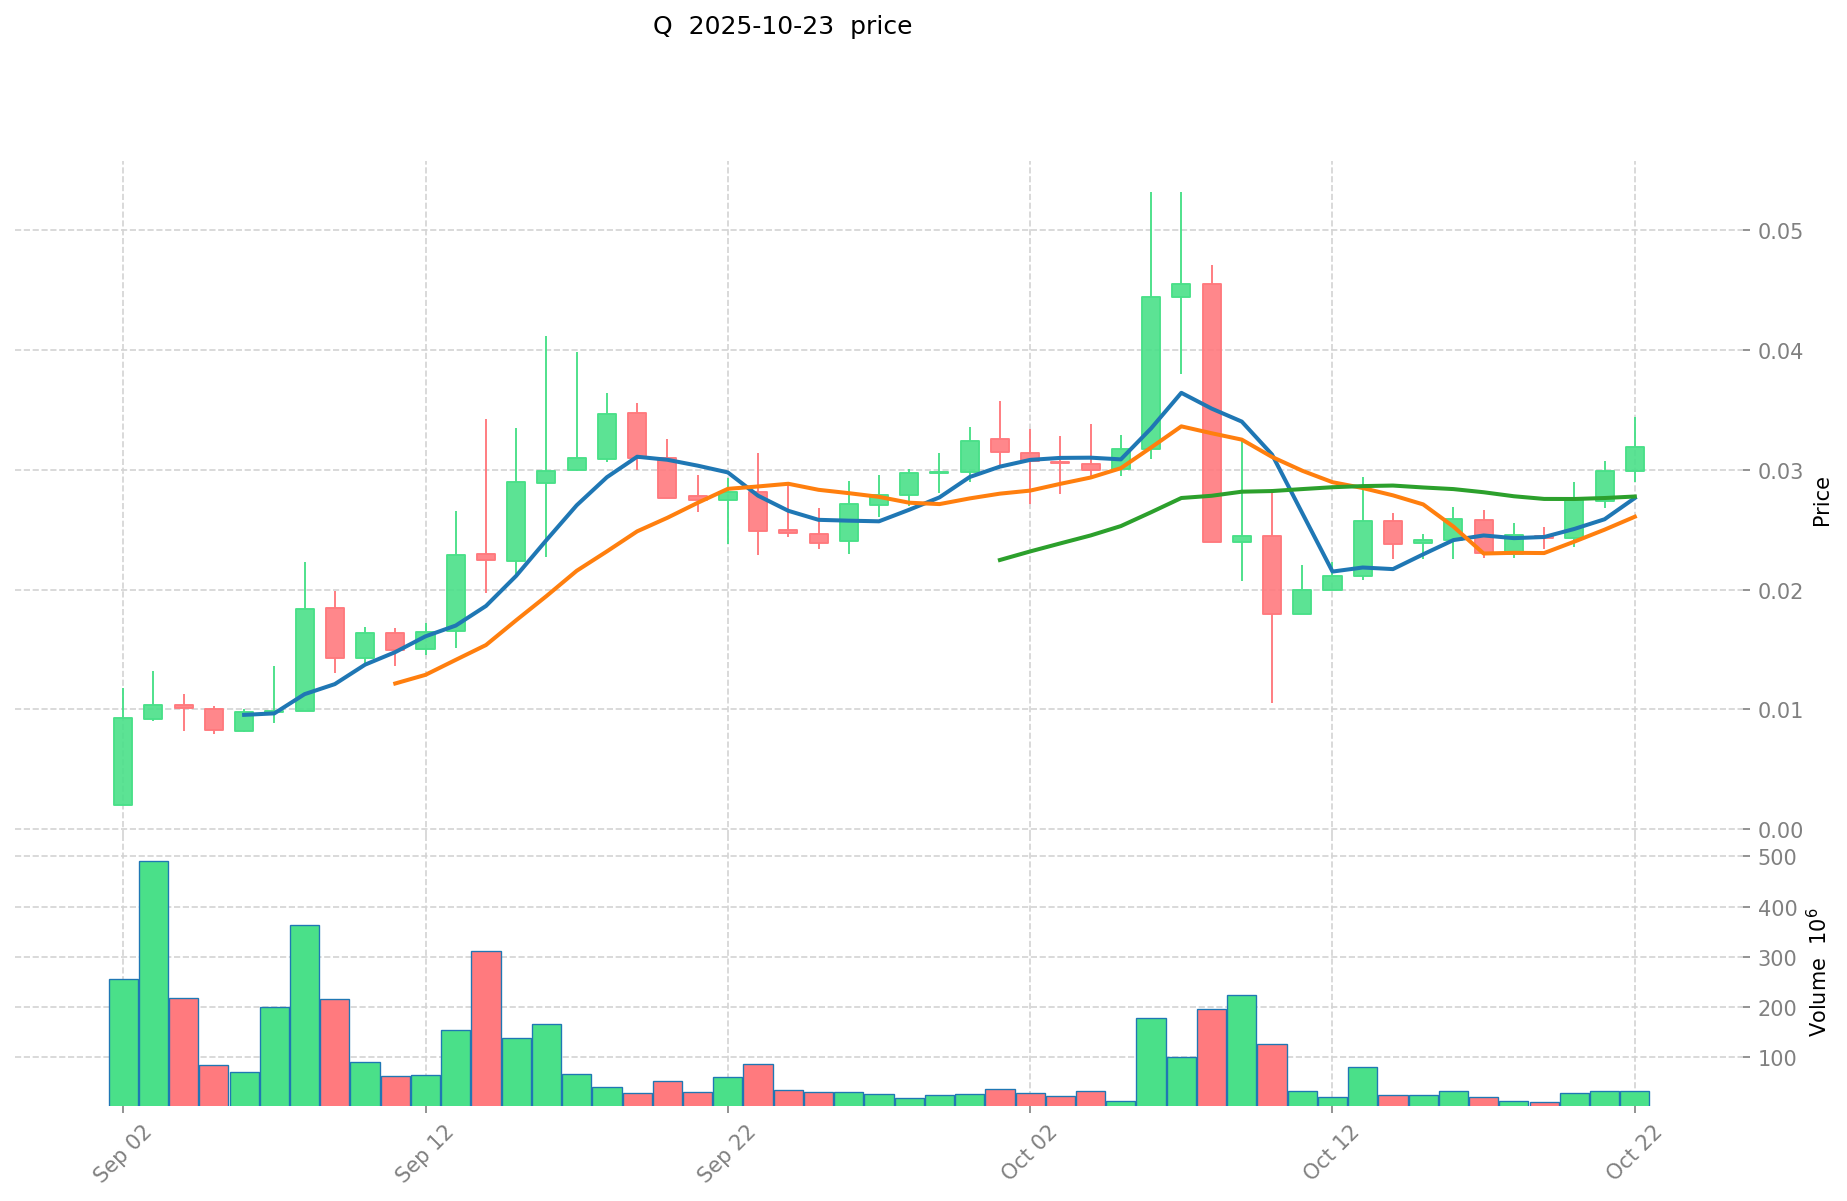
- 2025: Project launch, price started at $0.01
- 2025 September: Price reached all-time low of $0.002
- 2025 October: Price surged to all-time high of $0.053205
Q Current Market Situation
Q is currently trading at $0.032071, with a 24-hour trading volume of $1,035,920.83. The price has increased by 3.92% in the last 24 hours. Q's market cap stands at $51,826,736, ranking it at 597th position in the crypto market.
The circulating supply is 1,616,000,000 Q tokens, which represents 16.16% of the total supply of 10,000,000,000 Q. The fully diluted market cap is $320,710,000.
Q has shown significant growth in recent periods, with a 32.34% increase over the past 7 days and a 20.07% rise in the last 30 days. The current price is 39.72% below its all-time high of $0.053205 reached on October 7, 2025, but 1503.55% above its all-time low of $0.002 recorded on September 2, 2025.
Click to view the current Q market price
Q Market Sentiment Indicator
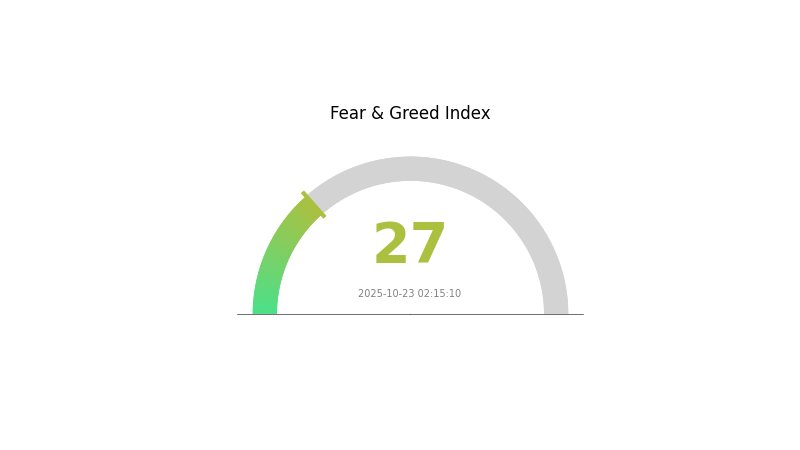
2025-10-23 Fear and Greed Index: 27 (Fear)
Click to view the current Fear & Greed Index
The crypto market sentiment remains cautious as the Fear and Greed Index stands at 27, indicating a state of fear. This suggests investors are wary and potentially looking for buying opportunities. During such periods, it's crucial to stay informed and consider dollar-cost averaging strategies. Remember, market cycles are natural, and fear often precedes recovery. Gate.com offers various tools to help navigate these market conditions effectively. Stay vigilant and make informed decisions based on thorough research and risk assessment.
Q Holdings Distribution
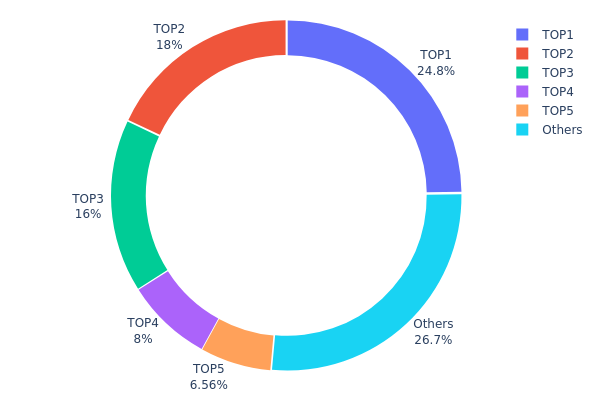
The address holdings distribution chart provides critical insights into the concentration of Q token ownership. Analysis of the data reveals a high degree of centralization, with the top 5 addresses controlling 73.33% of the total supply. The largest holder possesses 24.77% of all tokens, while the subsequent four addresses hold 18%, 16%, 8%, and 6.56% respectively.
This concentration pattern raises concerns about potential market manipulation and price volatility. With such a significant portion of tokens held by a small number of addresses, large-scale transactions by these major holders could substantially impact market dynamics. The centralized nature of ownership may also influence governance decisions and the overall trajectory of the project.
From a market structure perspective, this distribution suggests a relatively low level of decentralization. While 26.67% of tokens are distributed among other addresses, the dominant control exerted by the top holders indicates a centralized on-chain structure. This configuration may affect the token's resilience to market shocks and its ability to maintain price stability in the face of large sell-offs or accumulations by major holders.
Click to view the current Q Holdings Distribution
| Top | Address | Holding Qty | Holding (%) |
|---|---|---|---|
| 1 | 0x74d8...633f55 | 1238611.11K | 24.77% |
| 2 | 0x5214...852638 | 900000.00K | 18.00% |
| 3 | 0x78ac...c2671e | 800000.00K | 16.00% |
| 4 | 0xda6f...29d913 | 400000.00K | 8.00% |
| 5 | 0x7084...5a7169 | 328000.00K | 6.56% |
| - | Others | 1333381.35K | 26.67% |
II. Key Factors Affecting Q's Future Price
Supply Mechanism
- Global supply constraints: Limited supply due to resource country policies, long development cycles, and insufficient capital investment.
- Historical patterns: Supply shortages have led to price increases in the past.
- Current impact: Ongoing supply constraints are expected to support higher prices.
Institutional and Large Holder Dynamics
- Institutional holdings: Central banks continue to increase gold reserves, with China adding gold for 11 consecutive months.
- Corporate adoption: Growing adoption in new energy and AI sectors for industrial metals.
- National policies: Export quotas in Congo for cobalt and Indonesia's policies on nickel processing affect global supply.
Macroeconomic Environment
- Monetary policy impact: Market expectations of Fed rate cuts in 2025 are supporting gold prices.
- Inflation hedging properties: Gold and other metals are seen as inflation hedges amid global monetary easing.
- Geopolitical factors: Ongoing geopolitical tensions contribute to safe-haven demand for gold.
Technical Development and Ecosystem Building
- Green energy transition: Increasing demand for copper and aluminum in renewable energy and electric vehicle sectors.
- AI and data centers: Growing use of metals in AI infrastructure and data center construction.
- Ecosystem applications: Expansion of industrial applications for metals in various high-tech and green energy fields.
III. Q Price Prediction for 2025-2030
2025 Outlook
- Conservative prediction: $0.01897 - $0.03215
- Neutral prediction: $0.03215 - $0.03504
- Optimistic prediction: $0.03504 - $0.03793 (requires favorable market conditions)
2027 Mid-term Outlook
- Market phase expectation: Potential growth phase with increased volatility
- Price range forecast:
- 2026: $0.02593 - $0.04205
- 2027: $0.02505 - $0.05705
- Key catalysts: Technological advancements, wider adoption, and positive market sentiment
2030 Long-term Outlook
- Base scenario: $0.05482 - $0.06526 (assuming steady market growth)
- Optimistic scenario: $0.06526 - $0.08157 (assuming strong market performance)
- Transformative scenario: $0.08157+ (extremely favorable market conditions)
- 2030-12-31: Q $0.08157 (potential peak price)
| 年份 | 预测最高价 | 预测平均价格 | 预测最低价 | 涨跌幅 |
|---|---|---|---|---|
| 2025 | 0.03793 | 0.03215 | 0.01897 | 0 |
| 2026 | 0.04205 | 0.03504 | 0.02593 | 9 |
| 2027 | 0.05705 | 0.03855 | 0.02505 | 20 |
| 2028 | 0.05831 | 0.0478 | 0.02581 | 49 |
| 2029 | 0.07746 | 0.05305 | 0.04244 | 65 |
| 2030 | 0.08157 | 0.06526 | 0.05482 | 103 |
IV. Professional Investment Strategies and Risk Management for Q
Q Investment Methodology
(1) Long-term Holding Strategy
- Suitable for: Long-term investors with a high risk tolerance
- Operational suggestions:
- Accumulate Q tokens during market dips
- Set price targets and take partial profits at predetermined levels
- Store tokens securely in a hardware wallet or reputable custodial service
(2) Active Trading Strategy
- Technical analysis tools:
- Moving Averages: Use to identify trends and potential entry/exit points
- Relative Strength Index (RSI): Monitor overbought/oversold conditions
- Key points for swing trading:
- Monitor Q's correlation with broader crypto market trends
- Pay attention to project developments and governance proposals
Q Risk Management Framework
(1) Asset Allocation Principles
- Conservative investors: 1-3% of crypto portfolio
- Aggressive investors: 5-10% of crypto portfolio
- Professional investors: Up to 15% of crypto portfolio, depending on risk tolerance
(2) Risk Hedging Solutions
- Diversification: Spread investments across multiple AI and governance tokens
- Stop-loss orders: Implement to limit potential losses
(3) Secure Storage Solutions
- Hot wallet recommendation: Gate Web3 Wallet
- Cold storage solution: Hardware wallet for long-term holdings
- Security precautions: Enable two-factor authentication, use strong passwords, and be cautious of phishing attempts
V. Potential Risks and Challenges for Q
Q Market Risks
- Volatility: AI and governance tokens may experience significant price swings
- Competition: Emergence of rival AI governance platforms could impact Q's market share
- Market sentiment: Shifts in overall crypto market sentiment may affect Q's performance
Q Regulatory Risks
- Governance token classification: Potential for regulatory bodies to classify Q as a security
- Cross-border restrictions: Varying regulations across jurisdictions may limit Q's global adoption
- Compliance requirements: Evolving regulatory landscape may impose new compliance burdens
Q Technical Risks
- Smart contract vulnerabilities: Potential for exploits in the underlying smart contracts
- Scalability challenges: Possible limitations in handling increased network activity
- Integration issues: Difficulties in integrating with various blockchain networks and protocols
VI. Conclusion and Action Recommendations
Q Investment Value Assessment
Q presents a unique value proposition in the AI-native governance space for Web3. While it offers potential long-term growth opportunities, investors should be aware of the short-term volatility and regulatory uncertainties in the crypto market.
Q Investment Recommendations
✅ Newcomers: Start with small positions and focus on learning about AI governance in Web3 ✅ Experienced investors: Consider a moderate allocation based on risk tolerance and market analysis ✅ Institutional investors: Evaluate Q as part of a diversified crypto portfolio, focusing on its potential to disrupt traditional governance models
Q Participation Methods
- Spot trading: Purchase Q tokens on Gate.com's spot market
- Staking: Participate in governance and earn rewards by staking Q tokens (if available)
- Governance participation: Engage in the QuackAI ecosystem by voting on proposals and contributing to the community
Cryptocurrency investments carry extremely high risks, and this article does not constitute investment advice. Investors should make decisions carefully based on their own risk tolerance and are advised to consult professional financial advisors. Never invest more than you can afford to lose.
FAQ
Will QNT reach $1000?
Yes, QNT is projected to reach $1000 by 2030, based on long-term market analysis and current trends.
How much will 1 QNT be worth in 2030?
Based on current projections, 1 QNT could be worth between $550 and $900 by 2030, depending on market conditions and adoption rates.
Can quant reach $50,000?
While unlikely, Quant reaching $50,000 is not impossible. It would require significant market growth, widespread adoption, and favorable regulatory conditions.
How high can quant go in 2025?
Based on market analysis, Quant (QNT) could potentially reach a high of $124.46 in 2025, showing significant growth potential.
Share
Content
Introduction: Q's Market Position and Investment Value
I. Q Price History Review and Current Market Status
II. Key Factors Affecting Q's Future Price
III. Q Price Prediction for 2025-2030
IV. Professional Investment Strategies and Risk Management for Q
V. Potential Risks and Challenges for Q
VI. Conclusion and Action Recommendations
FAQ

